An example of permanent non-competitive inhibition is nerve gas, which block nerve message transmissions, resulting in death. Another example would be penicillin, which permanently blocks the pathways that certain harmful bacteria use to accumulate their cell wall components.
Amylase
Many organisms can digest starch therefore; amylase must be commonly manufactured in nature. For example, human saliva and pancreatic secretions are composed of large amounts of amylase for starch digestion. The specific bond ‘attacked’ by amylase is dependent on the sources of the enzyme. Based on the points of attack in the glucose polymer chain, the enzymes can be classified into two categories, liquefying and saccharifying.
Amylase, that randomly attacks only the alpha 1,4 glycosidic bonds belongs to the liquefying category. The hydrolysis reaction catalysed by this class of enzyme is usually carried out only to the extent that, for example, the starch is turned into a soluble enough substance to allow easy removal from starch-sized fabrics in the textile industry. The paper industry also uses liquefying amylases on the starch used in paper coating where breakage into the smallest glucose subunits is actually undesirable.
On the other hand, the fungal amylase belongs to the saccharifying category and attacks the second linkage from the non-reducing terminals of the straight segment of the starch molecule. This results in the two glucose units splitting off at a time. The product is a disaccharide called maltose. The bond breakage is evidently more widespread in saccharifying enzymes than in liquefying enzymes. The starch chains are chopped into smaller bits pieces.
Glucoamylase, which can be a component of amylase, selectively attacks the last bond on the non-reducing terminals. It can act on both the alpha 1,4 and the alpha 1,6 glycosidic linkages, which therefore results in simple glucose units splitting off into the solution. Fungal amylase and glucoamylase can be used together to convert starch to simple sugars. The practical applications of this type of enzyme mixture include the production of corn syrup and the conversion of cereal mashes to sugars in brewing.
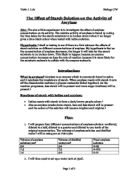
Hypothesis
The above shows the role of the enzyme amylase and the substrate starch in the following experiment. The enzyme breaks down the starch molecules into dextrin, maltotriose, maltose, and glucose molecules. The methods of breaking down the starch are explained in the plan.
In relation to the information about this topic in the sections above it would be appropriate to analyze the information to produce an educated hypothesis on how the substances involved will behave. The basis of the experiment is to investigate the effect of different concentrations of NaCl on the rate of hydrolysis of starch using amylase, therefore it would be appropriate to comment on the sodium chloride first.
Based on the information collected it is apparent that the Na+ ions in the NaCl solution are cofactors, which are described in the sections above. This is because Na+ ions are metal ions and therefore more likely to be cofactors than inhibitors, also they are more likely to be ‘helpers’ in terms of binding rather involved in the reaction themselves. This is because the reaction can take place without Na+ ions as well, if the Na+ ions were involved in the break down of the starch this could not happen. According to this the effect of increasing the concentration of NaCl would be an overall increase in rate of reaction. This is because the more Na+ ions, the more binding of the substrate to the enzyme active site, or the more active the Na+ ions are in the break up of starch.
The greater the concentration, the more Na+ ions are in the solution. More Na+ ions in solution means that more substrate-enzyme complexes are helped to be formed. The more the chances there are of enzyme-substrate complexes forming, the greater number of starch molecules get broken down. If more enzyme-substrate complexes are forming, the rate of reaction increases.
This is known as the collision theory. Therefore, it can be concluded that the rate of an enzyme catalysed reaction increases with increasing concentration of necessary cofactors, provided that the other conditions such as pH and temperature, are kept at a constant.
I predict that if an increasing concentration of NaCl is used with no change in volume of enzyme used, a saturation point may be reached. This is where the rate of reaction reaches a maximum and then it levels off due to saturation of enzyme active sites. At this point the active sites of enzymes are occupied with substrate molecules and any extra substrate molecules have to wait for a vacant active site. The presence of more Na+ ions will speed up the binding of substrates to the active sites, however, there will only be so many enzymes free for binding at any point in time.
Apparatus
The apparatus provided, as shown below, are the only pieces of equipment and chemicals that will be used in the experiment.
· Lab Coat
· Goggles
· Stopwatch
· Pipettes
· Syringes
· Test Tubes
· Test Tube Holder Racks
· Spotting Tiles
· Beakers
· 1% Starch Solution
· 1% Amylase Solution
· NaCl Solution
· Iodine
Distilled Water
Justification of Apparatus
Lab coat and goggles will be worn to protect against dangerous chemicals from being spilt on clothing, the body and from being squirted in the eyes. A stopwatch will be used instead of a normal clock as it is much more accurate, going down to milliseconds, and also because it can be stopped so that the final time can be recorded, making it very reliable as well.
The justification of using pipettes instead of more syringes is the fact that a pipette is designed for single drops of liquid substances where as with a syringe it would be far to easy to accidentally apply to much pressure and allow more than a drop of a solution to come out. Spotting tiles are very useful pieces of equipment as they provide storage for drops of solution as well as allow for the user to accurately and reliably compare the colour of the different solutions; therefore it would be appropriate to use them.
Syringes will be used, because the volumes of solutions to be used will be very small; therefore it would be more accurate to use a syringe to squirt a volume rather than using a large beaker. Also beakers will be used, as they would be enough to provide storage for the starch, amylase and NaCl solutions.
Distilled water is a lot more pure than normal tap water, therefore it less likely to have an effect on the solutions it is used in, in turn making the results more precise and dependable.The test tubes will be used to store the different solutions made for use in the experiment, as they can store small volumes of solutions and still allow them to be adequately accessible; test tube racks will be used, as they would provide support for the test tubes.
Iodine will be used as a measure of whether or not the starch has been broken down or not.
Variables
· Volume of amylase in the solution will remain constant. This will be very important because slightly more enzymes could unbalance the results completely as more enzymes would be available to break down the starch molecules.
· Volume of starch in the solution will remain constant. Again this is very important in order to prevent inaccurate and unreliable results.
· Volume of iodine solution in the spotting tiles will be kept as constant as possible though it may be difficult when using a pipette.
· Concentration of NaCl added to the solution will be varied, as it is centre of the actual experiment to find the effect of changing the concentration of NaCl on a starch-amylase reaction.
· Time is another variable as it is a measure of how long it took for the solution to turn from being blue-black into orange. It will change for different concentrations of NaCl. It will be measured in seconds.
· Temperature, pH and pressure will all be constant so that all results are accurate.
Method
1. Put on lab coat and goggles for protection against dangerous chemicals.
2. Using the markings on the 50ml³ beaker pour 50ml³ of starch solution into a beaker and label it ‘Starch.’
3. Using the markings on the 50cm³ beaker pour 50cm³ of amylase solution into a beaker and label it ‘Amylase.’
4. Using the markings on the 50cm³ beaker pour 50cm³ of NaCl solution into a beaker and label it ‘NaCl.’
5. Using the markings on the 50cm³ beaker pour 50cm³ of distilled water into a beaker and label it ‘Water.’
6. Label accordingly and place a syringe in each of the beakers.
7. Label accordingly and place a pipette in the ‘Water’ beaker.
8. Make up the following NaCl solutions and add them to 6 test tubes. Place these test tubes in a
test tube holder rack. Label these test tubes with the respective concentration:
9. Place one respectively labelled syringe in each of the test tubes placed in the rack
10. Using a pipette and the iodine solution, add a drop of iodine in each of the spots in two spotting tiles.
11. Using the syringe provided with the starch, add a drop of starch in the first spot of both spotting tiles. This will be the control representing the colour the solution should start off as if there is no break down of starch.
12. Using the pipette provided with the water, add a drop of water in the second spot of both spotting tiles. This will be the control representing the colour the solution should be after the amylase-starch and NaCl solution is added. Once this colour is reached the timer should be stopped.
13. Using the syringe in the starch beaker, add 2cm³ to an empty test tube and place it in the spare test tube holder rack.
14. Using the syringe provided in the NaCl solution test tube, add 3cm³ of the NaCl solution to be tested into the test tube with the 2cm³ of starch in it.
15. Label this test tube with the concentration of the NaCl solution used, i.e. 0.2.
16. Prepare 4cm³ of the amylase solution in the syringe provided in the beaker.
17. Add the contents of the syringe to the test tube and start the timer almost immediately.
18. Add a drop of this solution using a pipette to a spot in the spotting tile every 60 seconds.
19. Once the desired colour is reached then stop the timer and record the time.
20. Repeat steps 11-20 for each of the different concentrations of NaCl.
21. Repeat all the steps for each run of the experiment 3 times to obtain a reliable and dependable average set of results.
Pilot Experiment
For my preliminary work I will plan a pilot experiment first as a trial run. This will help me to confirm whether my planned method and choice of apparatus is appropriate and works effectively to produce reliable results. Also, it will allow me to make any amendments to the planned method if there are any significant inaccuracies, before the actual investigation is carried out.
Trial Run
Table to show change in time taken for an iodine solution to change the colour from blue-black into orange after single drops of a starch-amylase solution, containing different concentrations of sodium chloride, are added at 60 second intervals.
The errors in the plan are shown in the table by the fact that all the recordings are very close together and there is very little distinguishing between them. This would lead to inaccurate and reliable results, as it would imply that both 1 cm³ and 0.8 cm³ concentrations of NaCl produce the same time reading. This would also not show how far apart the actual readings were in seconds as both readings are in the first 60 seconds bracket.
Justifying Changes to Method
It would be appropriate to analyze the results obtained above before justifying the changes made to the plan. The results above are very close together and the reading show that the reactions occurred far too quickly; therefore it would be appropriate to reduce the amount of certain substances used in the solution.
First of all the volume of amylase should be reduced as the enzymes are breaking down the starch too quickly, therefore the volume should be reduced down to 2cm³ so that the starch does not get broken down almost immediately. This gives a chance to record some sensible results.
Next the volume of starch used should remain the same, as if it is also reduced, it will have the counter effect on the reducing of the amylase; therefore in order to increase the time taken to break down starch the volume of starch should remain 2cm³.
The volume of NaCl used should also be reduced, because, being a cofactor, it increases the ability of solution to form substrate-enzyme complexes. This in turn increase the rate at which the starch is broken down; therefore this gives justification to reduce the volume used down to 1cm³.
The time interval between each drop is too long, this shown by the fact that two different concentrations obtained the same time. Therefore in order to get a more accurate set of readings the interval should be reduced down to 10 seconds.
Last of all, a drop of water should be added to each spot with iodine in it. This would increase the amount of drops of the solution needed to change the colour back to orange. The more drops used, the more time spent; therefore it would help spread the results over an appropriate range to allow a conclusive analysis of the readings.
The amended plan, which has been drawn up taking into account the newly highlighted problems with the old method, is shown in the below section.
Amended Method
1. Wash out all the glassware before using any of the equipment.
2. Put on lab coat and goggles for protection against dangerous chemicals.
3. Set out all of the apparatus.
4. Using the markings on the 50cm³ beaker pour 50cm³ of starch solution into a beaker and label it ‘Starch.’
5. Using the markings on the 50cm³ beaker pour 50cm³ of amylase solution into a beaker and label it ‘Amylase.’
6. Using the markings on the 50cm³ beaker pour 50cm³ of NaCl solution into a beaker and label it ‘NaCl.’
7. Using the markings on the 50cm³ beaker pour 50cm³ of distilled water into a beaker and label it ‘Water.’
8. Label accordingly and place a syringe in each of the beakers.
9. Label accordingly and place a pipette in the ‘Water’ beaker.
10. Make up the following NaCl solutions and add them to 6 test tubes. Place these test tubes in a test tube holder rack. Label these test tubes with the respective concentration:
11. Place one respectively labelled syringe in each of the test tubes placed in the rack
12. Using a pipette and the iodine solution, add a drop of iodine in each of the spots in both spotting tiles.
13. Using the pipette provided with the water, add a drop of water in each of the spots in both spotting tiles.
14. Using the syringe provided with the starch, add a drop of starch in the first spot of both spotting tiles. This will be the control representing the colour the solution should start off as if there is no break down of starch.
15. Using the pipette provided with the water, add a drop of water in the second spot of both spotting tiles. This will be the control representing the colour of the solution should be after the amylase-starch and NaCl solution is added. Once this colour is reached the timer should be stopped.
16. Using the syringe in the starch beaker, add 2cm³ to an empty test tube and place it in the spare test tube holder rack.
17. Using the syringe provided in the NaCl solution test tube, add 1 cm³ of the NaCl solution to be tested into the test tube with the 2cm³ of starch in it.
18. Label this test tube with the concentration of the NaCl solution used.
19. Prepare 2cm³ of the amylase solution in the syringe provided in the beaker.
20. Add the contents of the syringe to the test tube and start the timer almost immediately.
21. Add a drop of this solution using a pipette to a spot in the spotting tile every 10 seconds.
22. Once the desired colour, see step 14, is reached then stop the timer and record the time.
23. Repeat steps 11-21 for each of the different concentrations of NaCl.
24. Repeat all the steps for each run of the experiment 3 times to obtain a reliable and dependable average set of results.
The justification of the procedures not yet explained is shown in the section below:
Justifications of Method
Justification of the method provides information that should be considered to obtain the most accurate results possible.
· The different concentrations of NaCl solution used for the experiment are 0.0, 0.2, 0.4, 0.6, 0.8 and 1 mol, as they would be easy to acquire, therefore reducing the risk of making a mistake, making the results more dependable. Another reason is that these many different concentrations would provide a valid range of results to draw a conclusion from.
· The starch-amylase solution containing different concentrations of sodium chloride will not be made up in advanced; it will be composed only when needed to prevent the recording of inaccurate results. This is because if it is made up in advance, the break down of starch will have already started.
· The timer will be started almost simultaneously to when the starch-amylase solution containing different concentrations of sodium chloride is made up so that each reading is accurate and reliable.
· All beakers, test-tubes, syringes, pipettes and spotting tiles will be labelled appropriately to prevent the accidental using of the wrong substances which would completely alter the observations of the experiment;
Risk Assessment
For every experiment a risk assessment is needed so that the person involved in carrying out the experiment is aware of all the hazards and the safety precautions to be taken to prevent any accidents.
· Stools and bags will be carefully tucked under benches to reduce the chance of tripping up when handling the apparatus;
· Work surfaces will be cleared to allow the apparatus to set up appropriately, which in turn will reduce the chance of spillages and breakages;
· All apparatus will be kept away from the edge of the work surface, especially glass equipment;
· An overall will be worn at all times during the experiment to protect clothes and body from dangerous chemicals;
· Goggles will be warn at all times during the experiment to protect the eyes from dangerous chemicals;
· Care will be taken when handling beakers and test tubes and other glassware from the cupboard;
· Syringes and pipettes will always be pointing away from the body and head to prevent accidental squirting of a dangerous chemical in the direction of the person;
· Enzyme, as well as any other solution, spills will be wiped up quickly and the area washed with water.
Observations
First Run
Table to show change in time taken for an iodine solution to change the colour from blue-black into orange after single drops of a starch-amylase solution, containing different concentrations of sodium chloride, are added at 30 second intervals.
Second Run
Table to show change in time taken for an iodine solution to change the colour from blue-black into orange after single drops of a starch-amylase solution, containing different concentrations of sodium chloride, are added at 30 second intervals.
Third Run
Table to show change in time taken for a iodine solution to change the colour from blue-black into orange after single drops of a starch-amylase solution, containing different concentrations of sodium chloride, are added at 30 second intervals.
Fourth run
Table to show change in time taken for a iodine solution to change the colour from blue-black into orange after single drops of a starch-amylase solution, containing different concentrations of sodium chloride, are added at 30 second intervals.
Average Results
Table to show average change in time taken for a iodine solution to change the colour from blue-black into orange after single drops of a starch-amylase solution, containing different concentrations of sodium chloride, are added at 30 second intervals.
Conclusion
The results tables and graphs show that the rate of break down of starch clearly increases as the concentration of the NaCl in solution increases. Graph 2 shows that the rates of reaction at which the starch is broken down increases at a faster rate with lower concentrations, however, the fastest rates of reaction are achieved with higher concentrations of NaCl in the solution.
The steep section of the second graph’s curve was obtained by the lower concentrations. These were the roughly and finely 0 to 0.4. This would suggest that the effect of adding NaCl solution with Na+ ions present, increases the rate of reaction.
Graph 2 shows how the overall rate of break down increases with concentration. However, the end of the curve seems to flatten out. This supports the idea in the hypothesis, whereby a saturation point may be reached. This is where the rate of reaction reaches a maximum and then it levels off due to saturation of enzyme active sites. At this point the active sites of enzymes are occupied with substrate molecules and any extra substrate molecules have to wait for a vacant active site.
The graph does not show direct proportion, as the line is not completely straight, the greatest rate of reaction occurs where expected, the highest concentration of NaCl, 1.0. This is therefore obviously a positive factor in the direction of proving that Na+ ions are cofactors, as the rate of reaction definitely increases with addition of NaCl. This therefore certainly dismisses the claim that a NaCl solution might just contain inhibitors.
The values for the control in all the tables are shown by the 1cm3 of water that was added to the solutions instead of the NaCl. In all tables, the values are far lower than when adding NaCl. The fact that the time taken for the break down of starch was low in relation to the other results helps explain that Na+ ions are not the type of cofactors that take an active role in the active site. This is because the reaction should be able to take place without Na+ ions if that was correct, however the reaction can take place without them even though it may be a lot slower. This is another point that might help prove that Na+ ions are ‘binding’ cofactors.
Graph 1 shows a general trend that as the concentration of NaCl solution rises the time taken for the break down of starch, according to the colour change of the solution, decreases. This matches my hypothesis as the greater the concentration of NaCl, the more Na+ ions are present in the solution. The greater the number of Na+ ions in solution leads to more substrate-enzyme complexes being formed. The greater the likelihood of enzyme-substrate complexes forming, the greater number of starch molecules are broken down. The more starch that is broken down the less time it takes for the colour change to occur. The faster the time recorded the faster the rate.
The fact that my overall trends and results support my hypothesis, is more evidence for the theory that as more Na+ ions are present, the more enzyme-substrate complexes can be formed, increasing the rate of break down, provided that other conditions such as pH and temperature are kept constant. Therefore conclusively Na+ ions are ‘binding’ cofactors when breaking down starch.
To statistically prove that the results obtained throughout this project were not due to chance I have conducted a t test.
Evaluation
By observing the graphs it would seem that there is only one major inconsistency. The point circled in Graph 2 where the rate of reaction reading corresponding to 0.4mol concentration of NaCl in solution is a little high. This may have been due to some larger drops of water in the spotting tiles for this particular run, as this would allow the iodine to change colour a lot easier than with the usual amount. This explanation is more feasible than stating that it was caused by inaccurate measuring on syringes as a pipette is not very accurate because there are no specified measurements on it. I think that these drops of water represent the main sources of error in my investigation.
The anomalous point above is cause for a little concern; therefore I can conclude that the results obtained are not entirely accurate but adequate to support the conclusion. The points that I would change in the method if there were no limitations to obtain more accurate results are shown below:
· I would carry out all the experiment runs on the same day so that the results are more as they take into account that the conditions were the same for all the different runs.
· I would use a more accurate pipette that allowed the user to check the volume of the drop before use; this would clear up the inconsistencies caused by adding too much water to iodine or adding less solution to the iodine solution.
· The time taken between adding the amylase to the enzyme and actually starting the watch would be shortened so that they are done simultaneously, improving both accuracy and reliability.
· I would use a stirrer to mix the enzyme-substrate and NaCl solution to allow efficient supply of all substances to all areas, i.e. areas of high concentration and areas of low concentration should be eradicated.
· I would use the same enzyme solution, substrate solution, NaCl solution and iodine solution, however this was sometimes difficult as some of the runs were carried out on different days.
However, this is not the only point that may have a claim to being anomalous as if the original results tables are examined, it can be noted that some of the values for time taken for colour change in seconds collected was surprisingly high for 0.2mol of NaCl in solution. In the third run table; 330 seconds were taken compared with the other tables. The increase is relatively high, even though the last run produced slightly slower time values.
This is probably due to factors such as inaccurate dilution of NaCl solution, which therefore would suggest that the actual concentration used must have been slightly lower 0.2mol. Another factor may have been that the tested solution may not have had chanced to mix, therefore the amylase would take longer to break down the starch due to lack of efficient supply of Na+ ion cofactors.
However, the inconsistency described above is only slight and do not generally affecting the overall trends as shown by the graphs. Therefore it can be concluded that there was only one anomalous point. Therefore I can conclude that my results are very reliable, due to the fact that all the three different runs of the same experiment produced the same trend of results, as they were all very close together, in terms of values, apart from the value described in the above. This is also shown in Graph 1.
I think that through the evaluation of the results that the conclusions, accuracy, reliability and validity of the experiment are very much secure. None of the anomalous points had a major effect on the trends. The results were accurate to one significant figure because it was possible to time the colour change from orange to blue black to the nearest 0.5 seconds. The results were reliable because I repeated the experiment four times and they produced a trend on the graph. The results did support my hypothesis.
By looking at my t test results it has statistically proven that the experiments conducted were not due to chance. Apart from, when comparing 0.8mol concentration of NaCl with 0.6mol concentration of NaCl and 0.6mol concentration of NaCl with 0.4 concentration of NaCl the null hypothesis was not rejected this could have been due to a number of reasons. But I believe it was mainly because of some larger drops of water in the spotting tiles for these particular runs, as this would allow the iodine to change colour a lot easier than with the usual amount. This explanation is more feasible than stating that it was caused by inaccurate measuring on syringes as a pipette is not very accurate because there are no specified measurements on it.