For this experiment I will vary only the concentration of the hydrochloric acid. I will not vary the temperature, the surface area of the particles and I will also not add a catalyst. This is to keep it a fair test.
If the temperature was varied and the beaker was heated the particles would move faster and so would have more collisions which would speed up the reaction. But also because of the higher temperature the particles will be colliding harder with more effective collisions than before. This may give the particles enough ‘activation’ energy to break the bonds so it is more likely the collisions will produce a reaction. I will not change the calcium carbonate from powder to larger pieces, as this would change the surface area. If larger pieces of calcium carbonate were used then the particle in the solution would have a smaller area to collide with – so fewer collisions will result in a lower chance of reaction. I will not add a catalyst because I want to see the effect of concentration by itself on a reaction – so a catalyst is unnecessary.
I will vary the concentration of the hydrochloric acid from a concentration of 0.4 M to a concentration of 2 M going up by 0.4 M each time. This is because 2 M is the highest concentration we are allowed to go to in Year 11 – any higher would be too dangerous. The readings of the syringe will be taken at time intervals from 5 seconds to 40 seconds going up in intervals of 5. I believe 40 seconds is long enough for the gas production to level off.
I can only be as accurate as the experiment allows – and in this case it is to the closest cm3. This is because I am reading my results off the gas syringe – and it is only accurate to a whole cm3. So for this reason all my results, including the averages of the results, will be to the closest cm3.
I will make sure all my results are reliable by repeating each one twice – this will allow me to identify anomalous results. This will give me, in total, 120 results. I will repeat any anomalies and state what they were in a separate table to the results.
This experiment is a good way to prove my results and carry out this investigation because it is safe and relatively easy to work. I will be wearing safety goggles to ensure my eyes are protected against the hydrochloric acid and there are no other major safety features. This experiment also allows me to easily record my results – the gas syringe allowing me to make my results accurate. I can also collect all of my data within a few lessons.
Before my actual experiment I conducted a trial, to see if my plan would work. I followed the description above in setting up the equipment and decided to measure the concentrations at 0.5 M, 1 M and 1.5 M. I chose these because they have a wide range – as do my chosen measurements. I also feel three measurements is a suitable number to test my plan.
For the concentration of 0.5 M I did not put the cork on fast enough so much of the gas escaped. This was because I was attempting to start the stopwatch at the same time. I realised it would be easier if somebody assisted me in starting the stopwatch so I could put the cork on so minimal gas is lost. I believe the other two concentrations worked well.
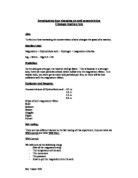
Diagram
Results
* These hyphened results were anomalies and were re-taken. My first attempt at taking these is listed in the Evaluation section in a table.
Conclusion
The results table and graph show that as the concentration of the hydrochloric acid increases the more gas there is collected in the syringe. The lines on the graph also show that the amount of gas produced at each of the concentrations decreased eventually as the time increased. We know this because the lines on the graph rise steeply and then level off – showing a decrease in the gas produced.
The more concentrated the hydrochloric acid the more the particles it has. Because of collision theory we know that the more particles of hydrochloric acid there are the more chance there is that there will be a successful collision with the calcium carbonate particles. This will result in a faster reaction.
For all of the concentrations of hydrochloric acid, the graph shows that they produced the most gas in the first 5 seconds and then gradually produced less gas. This is because the hydrochloric acid is most concentrated at the start of the timing, and so most successful collisions occur during this period. As there were then less particles in the acid the concentration of it fell and it had less particles to collide with the calcium carbonate. This explanation and the collision theory match the scientific explanation given in my hypothesis.
The results agree with my prediction – and the theory given in my conclusion is the same as that given in my hypothesis. I also predicted that the graph would rise steeply at first and level off – which it had done. The results fit my prediction fairly well, however I would have thought that the graph would have levelled off more in the 40-second time period. Apart from the slight difference in the graph, there is no major difference in the results from my prediction.
Evaluation
This experiment was a good way to carry out this investigation as enough results were taken to make a pattern clear. I drew enough results to make it clear that as the concentration of hydrochloric acid is increased more reaction rate is increased and more gas is produced. This was also a fair test as I only changed one variable – the concentration and nothing else. I also ensured that the experiment was carried out on a single day – if there was a week’s gap until my next opportunity to carry it out the weather may have changed affecting the temperature and that might affect the results.
This experiment only allowed my to be accurate to the closest cm3. I believe this was accurate enough to conduct this experiment, and my results – although only measured to the closest cm3 show a clear pattern.
I believe that my results are of a fairly wide range as I feel 40 seconds is wide enough time gap. I also investigated the largest range I could in terms of concentration considering the time limit in place. I feel my results are reliable enough as they have been repeated twice and they are all fairly close together and follow the predicted pattern.
I have put the two anomalous results of my experiment in a table. I have re-taken these for my final results but they are hyphened in the table:
I believe these low levels of gas production resulted in myself putting the cork on the test tube too slowly. This resulted in too much gas escaping though the test tube so not enough was collected in the syringe.
This experiment was a generally sound way of carrying out this investigation yet if I were to repeat it I would make a change. I would change they way the calcium carbonate was added to the hydrochloric acid as too much gas escapes this way. The calcium carbonate could be added through a tube which leads to the cork and that could then be sealed to ensure gas would not escape this way.
Although the graphs were beginning to level off at 40 seconds it may also be interesting to continue the timing to 60 seconds to see if the gas production had ceased completely.
On a higher level, this experiment could be conducted but with the concentration of hydrochloric acid could exceed 2 M and it could be investigated whether the pattern observed in this graph continues at higher concentrations.