2. Once a sycamore tree has been located, place a one meter ruler against the trunk of the tree and tie a rope around the trunk at the one meter point. A one meter ruler has been selected as it can be pushed against the trunk of the tree and the point of measurement is one meter. Measure the girth of the tree trunk using a measuring tape at this one meter point as a measuring tape can be wrapped around the trunk of the tree, whereas a ruler cannot.
3. Use a compass to identify the aspects of the trunk. Then mark each aspect one the rope, which has previously been tied around the trunk. Also, measure the light intensity using a light meter at the north mark, ensuring that the light meter is facing away, perpendicular, from the tree trunk. A light meter should be used because it gives the result as a number rather than reading it off a scale or meter due to it being digital. This removes any human error from reading the data.
4. Place the bottom of the quadrat against the rope, with the centre of the quadrat at the aspect point made on the rope. The advantage of an acetate quadrat is that it can be moulded round the curve of the trunk, whereas a plastic or metal quadrat cannot. The benefit of a ten square by ten square quadrat is that it gives a more accurate result than a five square by five square quadrat, or a ladder quadrat. When lichen is in contact with the bottom left corner of an individual square of the quadrat it should be recorded. Each square should be checked to see if the bottom left corner is in contact with lichen. This technique should be completed at each aspect of the tree, so an average percentage lichen cover can be calculated.
5. Stages 2 to 4 should be repeated until twenty five trees have been examined. A minimum of five trees would need to be examined to carry out the statistical test, and at least eight is desirable. A sample size of twenty five is likely to give a more reliable and valid result, however. The larger the sample, the more reliable and valid the results will be.
Results
The raw data collected at the site:
Analysis
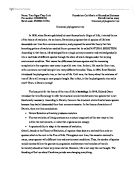
The statistical test of choice was Spearman’s Rank. This is because the null hypothesis “the girth of the tree trunk will have no impact on the percentage cover of lichen” needed a statistical test that would investigate the relationship between two variables - girth if the tree trunk and percentage cover of lichen - and also find whether the two variables were correlated.
The value calculated from the Spearman’s Rank statistical test was 0.7925. The critical value for a Spearman’s Rank test for a one tailed experiment with a sample size of twenty five is 0.3365, and the calculated value of 0.7925 is greater than the critical therefore the null hypothesis can be rejected, and the experimental hypothesis accepted. Therefore the girth of the tree trunk does affect the percentage cover of lichens and the results gained are not purely down to chance, but down to cause and effect.
Girth of a tree trunk can be used to measure the age of the tree. The larger the girth of the tree trunk, the older the tree. The more time the tree has been alive, the more time available for lichens to reproduce and grow on the trunk, therefore the more percentage cover of lichens. This means the larger the girth of the tree, the more percentage cover of lichens, which is the case according to the data and statistical analysis.
From the data collected, it is apparent that there is a higher percentage cover of lichen on the North aspect of the tree than other aspects. The average percentage cover on the North aspect is 49.92%, whereas the other aspects are 36.8%, 33.88% and 29.04%. Therefore there is a significantly higher percentage cover of lichens on the North aspects. This is because the North aspect of a tree does not get as much direct sunlight as other aspects, therefore moisture in the bark of the tree does not dry out. If the moisture dries out, the lichen dehydrate and die as they are not particularly adept at retaining moisture. Without moisture, the algal part of the lichen cannot photosynthesise and therefore cannot produce the energy containing carbohydrates to feed the lichen. So growing on the North aspect of the tree allows them to retain more water than on other aspect of the tree therefore photosynthesise more efficiently, hence the reason there is more percentage cover on the North aspect.
The light intensity data also indicates that lichen do not thrive in areas of high light intensity, however it shows that they do not thrive in areas of low light intensity either. For example - three ten had a percentage cover of lichen of 45.5% and the light intensity at that tree was measured to be 710 lux, and tree nine had a percentage cover of lichen of 39.5% and the light intensity at that tree was measured to be 608 lux – less percentage cover of lichen with less light intensity. They do not seem to thrive with too much sunlight where the bark would be dried out and cause dehydration, however they do need some level sunlight in order to photosynthesise efficiently. In photosynthesis there are light-dependant reactions where energy from sunlight is transferred into the production of ATP, and the coenzyme NADP is reduced to NADPH. These two products are then used in the light-dependant reactions to reduce carbon dioxide to carbohydrate. Therefore with insufficient sunlight, the algal part of the lichen would be equally poor at photosynthesis than with too much sunlight.
Evaluation
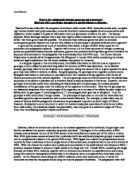
There are two anomalous results. Trees eleven and twelve do show the correlation that fits with the statistical analysis, however when the results are placed in a graph it becomes apparent that they are anomalous. They both seem to have an abnormally high percentage cover of lichens. The light intensity measurements at each of these trees are very close together, 644 lux and 638 lux respectively. Therefore this could well be the reason they both show larger amounts of lichen. Lichen require light to photosynthesise, however too much light can cause them to photosynthesis inefficiently by drying out the bark that they inhabit. So this value of around 640 lux could be considered as a peak value for light intensity for the lichens present on sycamore trees, and therefore show why these two particular trees have more percentage cover of lichen.
The ground around the base of the tree trunk was often uneven and varying in elevation. This presented a difficulty in where to place the one meter ruler and hence where to measure from. One meter at one aspect was often different at another aspect of the same tree due to the uneven ground. This difficulty was overcome by measuring from the highest point of the uneven ground at each tree, therefore creating a systematic approach, which was the same at each tree.
Measuring light intensity at each tree throughout the day was inaccurate. This is because the sun is at different points throughout the duration of the day, hence the different light intensity readings at different times of the day. To overcome this, a map was made of the area in which the trees were being examined and once all the lichen data had been collected, this map was followed to locate each tree that had been examined and measure the light intensity at the same time of the day. This meant that the light intensity data was more reliable as the position of the sun was consistent throughout the measurements.
The humidity levels of the atmosphere would impact lichen growth, as moisture is an integral component of photosynthesis. Humidity could not be controlled, but it could have been measured. Measuring humidity using a humidity meter would have given another variable to help explain results in more detail, hence given a more accurate and reliable result.
The lines on the quadrat defining the intersection points were thick, black lines. Therefore the intersections where lichen cover was recorded were relatively inaccurate and vague as the lines were so thick, it was difficult to pin point whether lichen were actually at that point and not simply close to it. Using a quadrat with thinner lines defining where the intersection points were could have reduced this source of error.
Much of the lichen on the trees was a similar colour to moss and algae. This presented a problem with distinguishing between the species. Some algae or moss could have been counted and equally some lichen could have been classed as moss or algae and therefore left out. A way to get around this problem would be to use a magnifying glass to look at the species more closely and therefore making it simpler distinguishing between the species.
Knuckles on the tree trunk were another issue. It was difficult to get an accurate measurement of lichen cover when the quadrat was not placed against the trunk due to a knuckle causing the quadrat to fold awkwardly. There is no real method to counter act this problem. The only thing to do was to attempt to measure as accurately as possible given the conditions.
Even with the difficulties of the investigation, the overall influence was still relatively low. The results gained were still accurate and the data and statistical test has shown them to be valid as the larger the girth of the tree trunk, the greater percentage cover of lichen. This was evident when carrying out the investigation. Without the sources of error, the results would be more accurate, however it is likely that the null hypothesis would still have been rejected, therefore the results are still reliable even with the sources of error.