The main aim of this experiment is to find the spring constant, k and see that is the effective mass, me small enough to be ignored.
I would do this by measuring oscillations of different masses on the spring and then using the equation below to work out my effective mass and the spring constant
Some teachers consider that the effective mass, me can be ignored as it is negligible. When I find the value of the effective mass I would have to see that is the value small enough to be ignored or not.
I was given the mass and the relevant extension data of the spring. By using this data and plotting the force against extension graph, I can work out the spring constant and that will help me to compare the spring constant that I get from carrying out my experiment I can also use the value of the spring constant that I get to work out what the effective mass of the spring should be.
The data for extension and the force is following along with a MS Excel generated graph that tells me the value of the spring constant.
I am liable to get a value for the spring constant and the effective mass that will be a bit different then the value that force/extension data will tell me because I would be carrying out this experiment differently technically and theoretically then the technique that was used to work out the force/extension data and the worked out spring constant form it.
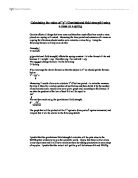
My graph and the value for spring constant is as follows
Figure 1 Graph Of Force/Extension Data
As you can see on the graph, that the worked out spring constant according to the force/extension data is 23.88.My value for the spring constant should be somewhere near around this value but I don’t expect it to be exact or very close due to some of the limitations and setbacks of the procedure used.
Justification For Design
The design for the experiment can be justified by the equation:
Where m = mass of the system and k = spring constant of the system.
Another equation that is going to help me to work out the height and the length is:
Where me = effective mass of the spring
I am going to re – arrange equation 1 to a straight-line equation form.
T2 = 4 π2 [(m+me)/k]
T2 = 4 π2 / k X (m+me)
T2 = 4 π2 / k x m + 4 π2 x me / k
Y = M X + C
As the solution to the equations tells us that to find me I must first find out the value for k. To work out k I will have to know the gradient of my straight line. To work out k:
M = 4 π2 / k
k = 4 π2 / M
To work out me then I will need to find the intercept of my graph. The accurate value for me is 9.0 g. Re –arranging the formula of the intercept will tell me how to work out me:
C = 4 π2 x me / k
me = C x k / 4 π2
Preliminary Results
Preliminary Graph
The graph of the preliminary results is done on the next page
If I use the results that I got and my graph the preliminary values that I get for k and me are as follows:
k = 4 π2 / M
k = 4 π2 / 1.373
k = 28.75
If I use this value of k my preliminary value for me would be:
me = C x k / 4 π2
me = 0.0125 x 28.77 / 4 π2
me = 0.00910 kg
My preliminary results come up with the value for k of 28.75 and value of me, which is 0.00910 kg.
The worked out value for k is quite different to the value that was obtained by the force/extension data. The value of effective mass, me isn’t that different to the real value. The actual values of k and me, are 23.88 and 0.00900 kg respectively.
The difference between these values could be due to the following reasons among with others:
- I couldn’t measure the time properly for the oscillations meaning that I took more time to react after I saw the spring go above or below the fiducial marker.
- It could also be because the mass added on the spring could have been a little different (e.g. 0.605Kg instead of 0.600kg) then mentioned on the mass itself.
While I am working for my real results I would have to careful about avoiding these mistakes or these reasons for errors as much as I can so that the value I get for k and me are more accurate.
Results
Results Graph
The graph for the final results is done on the next page.
Significant Sources Of Error
The difference between these values could be due to the following reasons among with others:
- I couldn’t measure the time properly for the period meaning that I took more time to react after I saw the pendulum go across the fiducial marker.
- It could also be because my height of small h could have been measured wrongly meaning there could have been an error of reasonable value on it.
Action Proposed To Minimise Errors
To minimise these errors I could:
- Use a laser beam as a fiducial marker that would count the number of oscillations and give me a accurate value of T.
- I could use a more accurate measuring equipment like a Vernier Calliper for example then metre rule for measuring h.
Analysis
If I use the results that I got and my graph the final values that I get for g and h are as follows:
g = 4 π2 / M
g = 4 π2 / 3.89
g = 10.14 N Kg-1
If I use this value of g my preliminary value for H would be:
H = C x g / 4 π2
H = 9.40 x 10.14 / 4 π2
H = 2.42 m
My final results come up with the value for g of 10.14 N Kg-1 and value of H, which is 2.42 m.
These worked out values are a bit different to the actual values and a lot better then the preliminary values. The actual values of g and h are 9.81 N Kg-1 and 2.50 m respectively.
Conclusion
According to the results and analysis carried out I have come to the conclusion that this technique is suitable to be carried out at a small scale for example in a laboratory but is not accurate at a larger scale like for working out the height of the bridge because the calculated results would likely have larger errors in them then this because the height and the time for the periods would have increased. This experiment could be carried out more accurately with different equipment. I can’t carry out this experiment due to the limited amount of resources provided and can’t suggest a technique as to lack of knowledge of technical scientific background.
The value of g is 10.14 N Kg-1. And the value of H is 2.42m.The value of g is closer to the actual value meanwhile the value of h is not accurate and satisfactory for this experiment to succeed at a larger scale.
Mathematically this theory came up with near accurate results but after the carrying out the procedure the results are not very reliable for a larger scale.
H = 2.42 m.
G = 10.14 N Kg-1
Measured Value of H = 2.50 m
Actual Value Of g = 9.81 N Kg-1
Difference in H = 2.50 m - 2.42 m. = 0.08m
Error in H = (0.08 /2.42) x 100 = 3.30 %
Difference in g = 10.14 N Kg-1 - 9.81 N Kg-1 = 0.33 N Kg-1
Error in g = (0.33 /10.14) x 100 = 3.25 %
The theory behind this technique and procedure was defined earlier.
Possible Sources Of Error
This is the same as significant sources of error.
Most Error Sensitive Measurements
According to the calculations that were carried out I came to the conclusion that the most error sensitive measurement is T2. Since we calculate this by squaring T. Hence an error in T would also be squared in T2.
Systematic and Random Errors
The random error in this experiment is the time when the pendulum bob goes pass the fiducial marker since it takes a bit of time to register the pendulum has passed the marker. And the systematic error in this experiment is the time it takes to stop the stopwatch after registering the pendulum.
Estimates Of Errors
My most significant error is the error for the height. The errors on the time are reasonably small.
Comment On Data Discrepancy
According to my graph and results I cannot find any results that are anomalous or inconsistent with the other results, this probably means that the experiment was carried sufficiently and gave results within a required degree of accuracy of each other.
Variations Of Repeats Or Uncertainty Of Data
I did not need to repeat any of readings because I found them to be quite accurate and consistent with the others hence I am sure that my results don’t need to be repeated for a better result.
Discrepancy Of Expected Results And Outcomes
My earlier predicted results have got some degree of accuracy within in them in this regard that the actual value of h is closer to the predicted value meanwhile the actual calculated value of g is far from the predicted value.
Comment On Technique Used
I think letting this experiment to run for three periods for all the heights and the repeats for the average was a wise decision in the regard that thirty periods are easy to time in the sense of both being reasonably fast and not lose track of the count.
Using more then thirty periods for the heights might not have been that accurate due to it taking more time and the increased number might result in losing count.
Less then thirty periods would insure that this technique could be applied in practise but would not be sufficient to form a reliable conclusion and analysis upon.
Comment On Reliability Of Conclusion
According to the analysis and the calculations made my conclusion would be reliable in the sense that the calculated value of g is quite good and accurate to the actual value of g meanwhile the calculated value of h is a bit far from the actual and predicted value. The percentage error in the actual value of h is 3.30%, meanwhile the percentage error of g is 3.25%.
This means that the conclusion is reliable more in favour of g than in h.
Future Improvements Or Further Work
As suggested earlier if the technique of the experiment was to be improved using an electronic timing device that is connected to a computer, so it can also help to plot the graphs. This method would avoid any additional time taken by the human and avoid any systematic error to quite an extent.
A second improvement could be that the for the height something suitable like a Vernier calliper or more then one set square be used to make sure that the height if the pendulum is accurate.
Cable Trunking Experiment - –