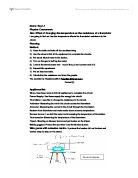
Thermistor
1800 Ohm Resistor
5v Power supply
Crocodile clips
Next I need to measure the maximum resistance of the thermistor at my middle range value. For my experiment I will be using a 1800 Ohm resistor. I will be measuring my output voltage of off my resistor in parallel.
During my experiment I am going to be measuring sensitivity, drift and response time.
I am measuring the sensitivity by measuring the output voltage at every degree in my range. I will then look at the changes in output voltages from one degree to another and see if I can identify any patterns or anomalous results.
To measure response time I will up two beakers one at a hot temperature and the other at a cold temperature. I will then place the thermistor into the cold beaker, until it reaches a stable output voltage, then I will put it in the hot beaker and time how long it takes for the thermistor reach a stable output voltage in the hot beaker. I will then repeat this going from hot to cold. Here I will be looking for speed in reaching a stable result and also differences in going from cold to hot and hot to cold.
To measure drift I will put my thermistor at room temperature and measure the output voltage every 10 seconds for one minute. Here I am looking for any anomalous results before the output voltage is stable.
Safety precautions will be taken into account throughout the experiment and goggles will be worn, hair tied back and apparatus set up carefully.
Results
The sensitivity of a measuring system is the ratio of change of output to change of input. In this case the change in output voltage is on each degree. The average degree change was 0.3 so the thermistor used in this experiment had an output voltage of 0.3.
A potential divider is often useful to scale down a potential difference by a known factor. In my graphs the range –5 to 50 degrees C is used as I believe that is a good range of English temperatures.
Graph 1 shows output voltage over change in temperatures and graph 2 shows sensitivity and average sensitivity of a thermistor.
Graph 1 shows an almost linear relationship which means out put voltage is proportional to change in temperature.
Graph 2 shows the average change in output voltage for each degree compared with 12 sensitivity ranges at different temperatures. There isn’t really much of a pattern and changes in sensitivity are very low. The sensitivity of low temperatures seems to be more below average than the sensitivity at higher temperatures. Which means readings at a lower temperature are more accurate.
The drift of a sensor is when an input signal may fluctuate. Small unsystematic errors occur but usual correct themselves. Graph 3 shows the change in output voltage at 10 second periods over the time of one minuet. This is the period where the output voltage may fluctuate before it reaches a stable reading.
Graph 3 shows that when the thermistor first receives the temperature the reading fluctuates slightly until it became stable. This test was done at 24 degrees C and it took 30 seconds for the sensor to reach a stable reading.
Response time is how long it takes for a sensor takes to react to a change in temperature. I have a table of results which I collect while timing how long it took for my sensor to reach a stable reading going from 3 degrees C to 80 degrees C and then back the other way.
My table of results shows that it takes 1 minute 15 seconds to reach a stable reading going from 3 degrees c to 80 degrees C. Then 44 seconds to go from 80 degrees C to 3 degrees C. You notice that the response time is noticeably quicker when going from hot to cold temperatures. This agrees with what was found out from sensitivity and it was more responsive at colder temperatures.
Summary
Originally I was aiming to make a sensor that allows me to measure the temperatures of a greenhouse.
The characteristics that I tested such as sensitivity proved appropriate for my sensor as it had a sensitivity of 0.03, which is accurate enough for measuring temperatures in a greenhouse. The fact that it is more sensitive when cold is good for a greenhouse sensor as plants are at more danger at the lower temperatures.
When I was measuring drift it did take 30 seconds to reach a stable reading but in the situation for which I want my sensor that sort of time is appropriate as extremely accurate readings are not necessary. The fluctuations were also very slight so it wouldnt effect results.
When measuring response time it took longer to go from cold to hot than it did to go hot to cold. It was a lot more responsive to the change to cold as also it is with sensitivity which will is good for my sensor as I need to know sooner when cold temperatures are coming.
After analysing certain aspects of my sensor I believe it to be it to be good enough to be used in measuring temperatures in a greenhouse as its sensitivity is accurate enough and drift and response time are also quick enough. Although this is not the most accurate sensor for this job it is good enough another one may be used if more accurate work is being done.