Dependent variables are variables that I will measure and are dependent on the changes made in the experiment, for this experiment, this is the change in mass and the change in length of each potato chip.
Independent variables are variables that are being changed in the experiment by choice and are not dependent on any other methods used in the experiment.
Control variables are variables that I wish to remain constant and need to keep the same in order to produce a fair test.
Variables in this experiment are listed in the following tables:
The control variables need to be controlled in order to have a fair test, without a fair test, the results would not be accurate, for example, if one solution were hot and another cold, this could affect the mass gain or loss, or the length gain or loss independently of osmosis taking place and would therefore produce incorrect data.
To explain why the control variables had to be controlled and how they were, I have drawn up a table below:
Obtaining the evidence
Equipment:
- One potato cut into five equal sized chips.
- A scalpel was used to cut the potato chips from the potato.
- Five test tubes were used to contain the solutions and one potato chip each.
- A test tube rack was used to hold the test tubes in place.
- A white tile was used on which to cut the potato chips.
- The solutions were measured out for us and left in plastic containers clearly labelled distilled water 10% sucrose, 15% sucrose etc.
- Paper towels were used to dry the potato chips once removed from the solutions.
- A ruler was used to measure the lengths of the potato chips.
- A balance was used to measure the mass of each potato chip, before and after the experiment.
- The wall clock was used to determine the time of the experiment.
- Labels were used for each test tube in order for them not to become confused with one another.
- Sucrose solution was used to mix with the distilled water.
Safety points:
- The potato chips were cut for us, otherwise students would have to ensure safe use of the scalpels and not to point them or carry them around as they could injure, the white tile was placed underneath to avoid cutting oneself.
- Students were warned that if any glass breakages were to occur, that other students were warned and the breakage swept away immediately into a safe container to be disposed of.
Number of readings:
The 5+3 rule would apply here where the minimum number of readings in order to plot a graph would be five and the minimum number of readings needed to take an average would be three, for this reason we took five readings for each solution, although I took six to increase the accuracy.
Concentrations of solutions:
- One solution was 100% pure distilled water and therefore 0% sucrose.
- The second solution was 5% sucrose and 95% distilled water.
- The third solution was 10% sucrose and 90% distilled water.
- The fourth solution was 15% sucrose and 85% distilled water.
- The fifth solution was 20% sucrose and 80% distilled water.
We each took five potato chips to place one chip in each solution. When the experiment was completed, we shared our results with five others, thus obtaining a total of five results for each solution.
Method:
- We collected five test tubes and placed them in a test tube rack.
- We labelled each test tube with the intended contents.
- We made collected the solutions from each plastic container and measured 20ml of each solution using a measuring test tube and added to each test tube.
- We collected a potato and it was cut into five equal chips for us using a scalpel, ruler and white tile.
- We measured the length of each chip and made a note of the mass of each chip.
- We placed the first chip in the first solution and noted the time of the start of the experiment. We waited one minute before placing the second chip in the second solution. We continued at one minute intervals until all chips were in the solutions.
- After one hour had completed, we removed the first chip, dried it once pressing down firmly on a paper towel, measured its length with a ruler and took a note of its mass using a balance. One minute later we removed the second chip and did the same. We continued at one minute intervals until all chips had been removed and measured.
- We then recorded our results in a table.
- The equipment was then safely cleared away and we shared our results with five others until we had five sets of data.
- I made a mental note of whether the chips were hard or soft after removing them from the solution.
The results collected were as follows:
I noticed that the chips placed in the 0% sucrose solution, 5% sucrose solution were hard and I could understand from this that they were turgid, the chips placed in the 15% sucrose solution and 20% sucrose solution had softened, showing that they had become flaccid. The chip in the 10% sucrose solution appeared to stay the same.
I notice that some people did not observe a change in length, but the majority of people observed a change in mass.
The negative values show a decrease and positive values show an increase in the change in mass and length columns.
Analysis
To simplify the results I made two separate tables based on the percentages of the changes noticed for each solution, for each student and plotted two graphs in Excel to demonstrate the data and I have also hand drawn the graphs on page 11 .
Percentage change in Mass:
Percentage change in Length:
Observations:
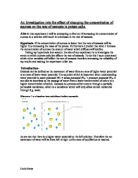
When looking at the percentage change in mass table and graph, it can clearly be seen that there is an indirectly proportional relationship between the percentage change and the concentration of sucrose in the solution. In other words, as the percentage of sucrose in the solution increases, the percentage change in mass decreases, so each chip became smaller when placed in a lower concentration of water solution (hypotonic solution).
This is in exact agreement with my prediction made in the planning stage. As stated, when osmosis occurs and plant cells lose water, they become soft and are known as being “flaccid”. In this case, the cell contents have shrunk and pulled away from the strong cell walls and the potato chip should feel softer to the touch, which is exactly what happened. From these results I can say that the experiment was an accurate and fair one and my results prove that osmosis has taken place by water moving from the cell to the solution.
When looking at the percentage change in length table and graph, it can be seen that there is a proportional relationship between the percentage change in length and the concentration of sucrose in the solution.
This again is in exact agreement with my prediction which stated that when osmosis occurs and plant cells take in water, they swell up and become hard, this is known as becoming “turgid”. The strong cell wall surrounding the cell prevents it from bursting.
Although there were some students who did not notice a change in length, taking the average of all readings demonstrates that the prediction was correct and thus the experiment was fair and accurate.
For both graphs, following the average line, it can be seen that the percentage change reaches zero at around 5% concentration of sucrose. This is when osmosis did not occur, where the solution is isotonic, or equal to the concentration of water inside the cell.
In addition, my personal observations of whether the chips had become hard, soft or remained the same further supported my original prediction and demonstrated osmosis had taken place.
Evaluation
I feel that the experiment was successful and the results were fairly accurate. I did notice that using mass as a variable to determine whether or not osmosis had taken place was more accurate as some students did not notice any change in length, this could be because the method of measuring the mass was more precise as the balance measured to two decimal places and the length was measured by eye using a standard ruler. To make the length more accurate a micrometer could have been used, in addition the width measurement could be taken as well so as to calculate the volume increase of the potato cell as it could be some chips increased in width rather than length and so a change was not noticed in this experiment.
There were some anomalous results that did not fit to the average points plotted on the graph, I believe these were due to human error and the fact that we shared our results. I feel that had we made several tests for each solution strength individually these errors would be minimised. I would also prefer to do about ten repetitions for each solution in order to get a very strong average reading for each sucrose strength. The other anomalous results noticed were the lack of change in length being observed. I can only analyse this as a possible inaccurate method of measuring after osmosis had occurred, or an inaccurate method of cutting them in the first place.
Even though I stated in the planning that the potato chips would be cut to the same length and mass, the potato chips were cut for us and we noticed that they were not always equal, I believe this also affected our results. With my own potato chips, I noticed that the ends had not been cut square, in fact they were rounded and so length could not accurately be measured. I cut the rounded ends and made all chips 40mm in length rather than the original 50mm, but discovered others had lengths varying between 40mm and 55mm. I feel that to improve the fairness of test, a potato chipper machine could be used or a crudités tool could be used to ensure the same thickness of chip were cut, they could then be cut to an equal length, lining them up to a square edge rather than being cut by hand measuring by eye as they were for our experiment.
An additional point was the method used to time the experiment, we had to use a wall clock rather than a stop clock and so exact time measurements could not be made as it was difficult to see exactly when one minute had passed. To improve upon this point, I would use a stop clock next time.
Although a varied range of sucrose solutions was used, I would like to use a wider range of solutions in order to determine exactly when plasmolysis occurred. I would also like to leave the chips in the solution for a longer time period in order to discover the saturation point of the potato cells.
As the test tubes were open to the air, evaporation could have occurred and some solution could have been lost, to prevent this, bungs could be used to stop the test tubes.
The temperature was not kept constant throughout the experiment, although I had planned to do so, this could be improved by possibly using a water bath to keep the temperatures the same throughout the duration of the experiment.
A more consistent method of drying the chips could be used, rather than using paper towels and guessing that the same pressure was exerted on all chips to dry them.
Different types of potato could be used to compare the results between them, or other varieties of vegetables or fruit.
To conclude, the experiment was accurate and fair, however many changes and improvements could be made, as listed above. The experiment demonstrated osmosis had taken place, but with the improvements listed above, a more accurate set of results could be obtained.
BIBLIOGRAPHY
- Human Biology, Collins Advanced Science, second edition 2002 by Mike Boyle and Kathryn Senior
- GCSE Double Science Biology, The Revision Guide Higher Level, Coordination Group Publications Ltd, 2005 by Richard Parsons.