Physics coursework; Finding the focal length of a lens using a graphical method.
Physics coursework; Finding the focal length of a lens using a graphical method.
Planning:
Firstly the rough focal length of my lens will need to be found to assist me in my real experiment. A simple way to do this would be, to hold the lens up to a flat white wall opposite a window when it is light outside, by moving the lens closer/ further away from the wall until an upside down image of objects outside the window (e.g. trees,) is produced, I can estimate an focal length for the lens which provides me with the minimum distance of (u), this saves time that would be spent trying to find a point from which I can begin measurements.
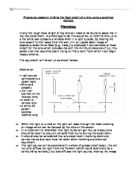
The equipment will be set up as shown below:
Apparatus:
- Light source connected to a power pack
- Wire grid (object)
- 1m ruler (correct to the nearest mm)
- a small bi-convex lens
- a white 2D screen (approx 100*70 mm)
- When the light is turned on the light will pass through the mesh creating an image which can be focused by the lens on the screen.
- It is important to remember that light bulbs will get hot, so precautions should be taken to ensure I am safe from burns during the experiment.
- It should also be considered that any experiment involving electricity carries risk so due care must be taken when handling any electrical equipment.
- The light source will be covered with a sheet of grease proof paper, this will not only diffuse the light from the filament (which could potentially be a confounding variable,) but also diffuses the light source, making the image from the wire easier to focus on the screen by decreasing the depth of focus.
- Since the lens is quite small it may be unstable in the lens holder, slight movement of the lens in the holder could affect the results so to solve this problem I will attach the lens to its holder with blu-tac.
- All pieces of equipment will be lined up against a ruler which is affixed to the table and by using a set square; the object, the lens and the screen can all be positioned at 90 degrees to the ruler. This ensures the equipment is aligned at all times along the principle axis.
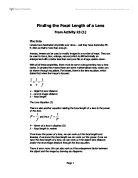
- I will take the required measurements by setting the distance u (which will begin at 250 mm (because that is a higher measurement than the rough focal length I will have found earlier,) and increase by 25 mm each time.) By adjusting the distance from the lens to the screen; (v), a focused image can be produced on the screen.
- By rearranging the equation, f = 1/u + 1/v, as shown below;

This is a preview of the whole essay
Peer Reviews
Here's what a star student thought of this essay
Quality of writing
The spelling, grammar and punctuation are sound. I would suggest giving a glossary of terms for this piece of work as for A level, there are some words which need defining and such definitions illustrate the further understanding of the student to the examiner of the topic. This helps gain higher marks, as it would count as an 'extra step' which the student has taken and differentiates this piece of work to another. The student follows the typical convention in terms of layout which was very sensible as it is the best and clearest way to present such a piece of work.
Level of analysis
The level of analysis was fine for A level. I would say perhaps a further detailed explanation in places would help further show the understanding of the student, however this may not be compulsory for the board to obtain full marks. The judgements were made with the suitable evidence and the correct conclusion was reached. The clarity of the work helped the fluency of it too. Naturally, the piece of work flowed to the conclusion which is good because it is very hard to follow an experiment and its results when the layout is not clear.
Response to question
This piece of work is presented in a clear and logical way. This helps the examiner identify the areas for awarding marks very quickly and reduces any questions over whether the student has answered the question set or not. The answer was very explicit and the diagrams aided the work as it supported what the student was saying in their written work. However, I would say there are few areas in which I feel are needed to ensure that the highest marks are obtained. Firstly, I would strive to explain every step in detail and explain why the step is necessary. The tabulated results showed repeats and then an average. It could be best to show the calculation to find the average (even if it is very obvious) and state why repeat readings were taken and hence why an average was taken. Such extra things really differentiate this piece of work from another. However, as always, the criteria for each board is different, therefore it is always best to check the requirements of the board for obtaining the highest grades.