s = ½at2 The ‘½a’ is the constant in this equation
s = kt2 Remove constant to leave only two variables
s α t2
Since u = 0 m s-1, the ball bearing must have experienced some force to make it accelerate down the slope. Assuming there is no further human involvement after it has been placed on the smooth slope, the weight of the ball bearing would be the only force constituting to its movement.
m = 28.82 g = 28.82 × 10⁻³ kg
g = 9.82 N kg-1
w = mg
w = 28.82 × 10-3 × 9.82
w = 0.282436 N
The weight of the ball acts directly downwards though, so this value is not the true force. However, we can say that the acceleration of the ball bearing would remain unchanged at all values of distance because the weight is constant.
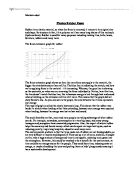
We can work out the equation of this graph by substituting any coordinate, in which the line of best fit passes through, into the general square equation:
(1.00, 2.54)
y = k√x → k = y ∕ √x
k = 2.54 ∕ √1.00
k = 2.54 → y = 2.54√x
t = 2.54√s
Example; if the ball bearing was 0.40 m from the bottom of the slope, then according to my equation, the time taken should be 1.61 s.
t = 2.54√s
t = 2.54√0.40
t = 1.61 s
Compared to the true value, there is only a difference of 0.02 s, which illustrates how accurate the equation can be. Although calculations for the other values of distance are not shown in this report, they have been tested and show the same concept. Also, the fact that distance and time can be linked together via an equation is further proof that there is a strong relationship between the two variables.
In order to analyse this graph further though, we would need to convert it into a straight line graph. To do this, we can plot distance against time squared. Since s α t2, we can predict that the graph would be linear.
Graph of distance against time squared
True acceleration of ball bearing
As you can see from the table above, my prediction of acceleration being 0.30 m s-2 is relatively accurate. However, there are two anomalies, which give particularly high values for the ball bearing’s acceleration.
The cause of this is most likely a measurement error, since a human-controlled stopwatch was used to measure the times. To time how long a ball bearing takes to move down the slope accurately is extremely difficult, especially when it takes only a fraction of a second. The use of light gates in place of the stopwatch is one method to overcome this problem.
Theoretical acceleration of ball bearing
It is also possible to work out the acceleration using Newton’s Second Law of Motion, F = ma.
Kinetic energy of the ball bearing
Analysis
Since the ball is moving down a slope, there must be a drop in gravitational potential energy. As the ball moves down, it also gains speed and kinetic energy though. According to the First Law of Thermodynamics, energy cannot neither be created nor destroyed but can be converted from one form to another.
Thus, we can conclude that gravitational potential energy is converted into kinetic energy as the ball travels down the slope.
G.p.e = mg∆h
K.e = ½mv2
G.p.e = K.e
mg∆h = ½mv2
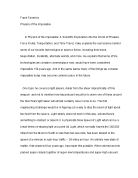
So, although the above graph is one of distance against kinetic energy, the relationship for distance against gravitational potential energy lost would be exactly the same. However, there may be slight differences since some of the energy may be converted into heat.
The graph displays a linear relationship, and shows that the ball bearing’s distance from bottom of slope is directly proportional to the kinetic energy. The general equation linking the two variables together will be y = kx - where k is an unknown constant.
(0.50, 4.50)
y = kx → k = y ∕ x
k = (4.50 × 10⁻³) ∕ 0.50
k = 9.00 × 10⁻³ → y = 0.009x
K.e = 0.009s
By substituting in the coordinate (0.50, 4.50), we have found the constant. In doing so, we can deduce an equation which allows us to calculate the kinetic energy of the ball bearing providing we know the distance from the bottom of the slope. However, this equation would only work if the slope remains as 5˚.
The constant in the equation is the same as the resultant force which we have calculated using Newton’s Second Law. This is due to the fact that the weight is a constant, and in this particular experiment, weight is the only force which controls the force at which the ball bearing moves down the slope.
Therefore, we can replace the constant in the equation with the resultant force to give K.e = Fs. This should enable us to calculate the kinetic energy of a ball bearing travelling down a slope no matter what the angle of the slope is.
From this graph, we can see another anomaly, which is highlighted in red. This point is an anomalous result because it shows that the ball bearing has less kinetic energy when s = 0.95 compared to when s = 0.90.
The cause of this anomaly would most likely have been due to some experimental error. As explained before, the experiment appears to have been carried out by a human, so there will be quite a lot of systematic error. The person who carried out the experiment may have stopped the timer on the stopwatch to early or too late, leading to results which do not reflect my predictions.
As you can see, this anomaly cannot be identified in any of the previous two graphs, so it was necessary to produce a distance against kinetic energy graph as well. Another reason as to why I produced this graph was to confirm my value for resultant force derived using Newton’s Second Law.
Error
Other sources of error may be the resolution of the sensors used. The stopwatch is said to have a resolution of 0.01 s, which appears to be a reasonable figure within the context of this particular experiment. The error would only be ± 0.005 s; so even when the time is only 0.46 s, the maximum percentage error is approximately 1.09 % - a fairly negligible figure.
Also, although not specifically mentioned, we can take the resolution of the equipment used to measure distance from bottom of slope as being 0.01 m, and thus error would be ± 0.005 m. When measuring a distance as small as 0.05 m, the percentage error can be as large 10 %. This is fairly significant, and can have a dramatic effect on the accuracy of the results. Therefore, a more preferable resolution for this measuring equipment should be 0.001 m, where there is a max percentage error of only 1%.
Repeatedly constantly throughout this report is the influence of human systematic error on the accuracy of results. The most significant part of human error can be seen when we try working out the acceleration of the ball bearing at the various distances from bottom of slope. The response time of a human can delay the starting and stopping of the timer of stopwatch. This time delay would not be constant, leading to error and anomalous results. The problems can be seen more clearly when the distance from bottom of slope is very small. It is very difficult to start and stop the timer accurately, when the difference between the ball bearing starting to move and reaching the bottom of slope is less than a second.
As suggested earlier, the most probable method of improving the experiment would be to use electronic devices such as a light gate. As well as containing less systematic error, this would improve the reliability of results because there will be more consistency in the rate of error as well.