Are mobile phones a health risk?
Abstract In this report I aim to determine whether or not mobile phones pose a risk to our health. I will explain how mobile phone electromagnetic radiation can be perceived as dangerous, with reference to the EM spectrum. I will cite scientific sources of evidence which support both sides of the dispute, and will come to a reasoned conclusion as to how likely it is that mobile phones are a health risk. I will also evaluate the credibility of the sources used to support my conclusions, and list all the sources used throughout in a detailed bibliography. Introduction Mobile phones are becoming increasingly popular in today's world; with around 80 million handsets in Britain, there are now more mobiles than people [1]. They've become an essential part of our existence, in business, in our daily lives and in keeping in touch with our loved ones - however, there is growing concern that this technology is causing serious health problems throughout the population, such as lasting brain damage and cancer. The Media consistently tends to portray mobile phones negatively, fuelling the public's fears and misgivings: this study aims to determine from the scientific evidence whether or not mobile phones present a risk to our health. Main Points How might Mobile Phones be Hazardous to our Health? After studying numerous publications, I have found that if there are concerns about how

The Physics of Windsurfing
INTRODUCTION You glide across the surface of the water at unbelievable speeds, steer towards a white capped wave, and then lift off like a bird, each muscle resisting against the force of the wind. Then you smash into the trough of the wave, leap up from near disaster, and look quickly for the next wave so you can do it all over again. This is the exciting sport of windsurfing. THE BEGINNING Windsurfing began in the '60s when an aeronautical engineer and a scientist had a discussion. In 1969, the engineer presented an idea entitled "Wind Surfing: A New Concept in Sailing." This new concept involved releasing the mast from its fixed vertical position and allowing it to turn around its base (Now a days the vertical positioning is not fixed) The sailor then can both steer and balance the board through correct movements of the mast and sail. The early Windsurfer boards measured 12 feet (3.5 m) long and weighed 60 pounds (27 kg). WHAT IS A SAILBOARD? A sailboard is composed of a board and a rig. There is variation in modern sailboards; they generally range from 8 to 12 ft (2 to 4 m) and weigh between 7 to 18 kg; some have attained speeds of over 40 knots CONTROL AND MOVEMENT There is lower pressure on the forward part of the sail and a net force perpendicular to the sail. The net force propels the windsurfer, but part of this force is to the side of the sailboard. The

AS OCR B Advancing Physics Coursework - Making Sense of Data
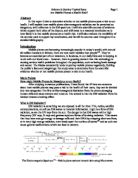
AS Physics Coursework - Making Sense of Data An experiment was carried out in which the velocity of a falling mass was measured using a light gate: The results are shown in the table below: Height Above Light Gate (mm) Velocity #1 (m/s) Velocity #2 (m/s) Velocity #3 (m/s) 20 0.61 0.62 0.51 70 .12 .11 .10 20 .52 .62 .50 70 .76 .72 .79 220 .93 2.03 .99 270 2.26 2.28 2.30 320 2.45 2.50 2.46 370 2.62 2.67 2.63 420 2.84 2.80 2.89 470 2.96 2.97 2.99 520 3.18 3.13 3.20 570 3.30 3.44 3.34 620 3.53 3.53 3.40 670 3.62 3.64 3.67 720 3.84 3.62 3.83 770 3.86 3.84 3.83 820 4.03 3.97 3.99 870 4.18 4.12 4.14 920 4.36 4.41 4.20 Provided with these results I have initially decided to look at any relationship between the actual figures collected, with the plan of calculating and exploring further data later. I am therefore looking at the relationship between the distance the object fell, and its velocity as it passed through the light gate. An average of the velocities measured in each experiment has been calculated and the height at which the weight was dropped has been multiplied by 1000 to convert it to metres. I have created a graph of these values. Distance fallen /m Average Velocity/ ms-1 0.02 0.58 0.07 .11 0.12 .55 0.17 .76 0.22 .98 0.27 2.28 0.32 2.47 0.37 2.64 0.42 2.84 0.47