Controlled Variables
Calculations (making 1M sugar solutions):
In order to synthesis the standard solutions of each substrate the substrate must be dissolved in fixed. In this investigation I will need to determine the mass of sugar needed to be dissolved in 1000cm3 of water to create a 1M sugar solution. I have included my calculations in the table below.
A control experiment will be conducted parallel to the actual experiment. The experimental control that I will be using will be a boiling tube containing yeast and will be placed in the same water bath as the experimental boiling tube (yeast and substrate together). I will also place another tube containing only the respiratory substrate in the same water bath. The experimental; control will be exposed to the same experimental conditions and will be timed for the duration of the experiment. Thus the purpose of the experimental control is to ensure that the volume of C02 produce is from the respiration of yeast with substrate (which requires the yeast to digest the substrate) and not any other external factors (apart from residual glucose).
Data Analysis:
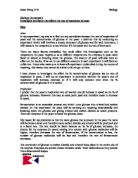
Below is an example of the type of table which can be drawn up to analyse the results which are obtained from the experiment, it shows clearly the results obtained in a logical order for each of the substrates used in the experiment.
Table to show the volume of CO2 gas produced for each substrate
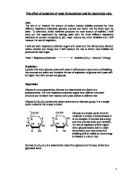
Exemplar Histogram
Below is a histogram which represents the volume of CO2 produced by the different substrates. If there is an overlap between the results of the two substrates as shown below, than I must carry out the statistical test called the T-test will need to be carried out which will provide me with a probability of the likely hood that my null hypothesis is true.
In order to accurately and clearly identify if there is any significant difference between the volume of CO2 produced and the different substrates, I will therefore produce frequency histograms to compare each substrate with another. If there is no overlap between the histograms then it is graphically clear that a substrate causes more production of c02 volume than another. However, if there is overlap between the histograms, then using the graph alone is inaccurate and inadequate for me to establish whether there is any significant difference between the type of substrate and volume of c02 evolved. Hence I will conduct the Students T test in to compare two sets of data and to calculate whether there is any significant differences between the two sets of data.
A T test is used to compare the mean of two sets of data and it takes into consideration the standard deviation of the two sets of data. As I will be using a large sample size due to the vast number of repeats, I will expect my T value to be low. I will then use the relevant T value from a table of degrees of freedom. If my calculated T value is greater than or equal to the critical value, there will be a significant difference between the effects of substrate on the volume of CO2 produced and I will therefore be able to reject my null hypothesis. However, if my T value is less than the critical value then I will accept my null hypothesis.
T test formula:
Implementation
Modifications
- The gas syringe is an inefficient method of measuring the volume of CO2 produced in the experiment as there is too much friction within the syringe; hence the syringe is unable to show the amount of C02 gas that has entered the syringe. Thus I will change my method and apparatus by using the invested burette water displacement method, which inaccurate to 0.1 cm3 (which is more accurate that the gas syringe).
Modified method
- I will fill the burette with water, and using my thumb to completely cover the top of the burette and submerge into water
- Once totally submerged in water I will remove my thumb, and secure the burette by clamping it
- I will take the reading of the meniscus, to identify where the starting point of water is and then deduct any changes from that to calculate the actual change in volume (caused by production of C02 gas)
- I will read from the apex of the meniscus to ensure that accurate readings are taken
- I will place the delivery tube into the opening of the burette, which will be connected to the conical flask.
- In my plan I was originally going to use a boiling tube for the yeast/substrate reaction. However I have found out that this reduces the surface area of the yeast and causes the yeast to sediment at the bottom of the boiling tube. Thus I will use a conical flask to ensure that the yeast does not sediment by maintaining a larger surface area,
- The yeast ‘solution’ is not a solution, as the yeast in merely suspended in solution, thus forming a colloid. The stock yeast solution must be stirred before used. I will add the sugar to the yeast as the yeast is a colloid, and I will not contaminate the solution with either sugar or yeast.
- As the yeast solution sediments, I need to swerve the conical flask (containing yeast and sugar substrate) during 5 minute readings approximately 5 times in the clockwise direction to re-suspend the yeast.
- I will change the concentration of sugars to 0.4M to prevent the yeast from being killed by osmosis. Thus I will change the volumes of yeast and substrate used, using 35cm3 of yeast and 10cm3 of sugar.
- The temperature of the water bath has been set to 40°C
- No buffer solution is available; therefore I will not be able to control the pH of solution. However I will measure the pH at the start and termination of each experiment to measure the pH using indicator paper.
- Substrates that are going to be used are: glucose, fructose, maltose, sucrose and lactose. The expectation is that lactose produces no C02 as yeast does not possess the lactase enzyme (to digest lactose into its monomers).
- However, a small amount of C02 will be produced when experimenting with lactose, as residual glucose within the yeast that will be used for respiration. Therefore I will leave the east in the water bath for 1 hour before the experiment to ensure that the residual glucose has been respired.
- All substrates will be repeated twice (except lactose which will be repeated just once) and I will use 2 controls per each experiment (test tubes containing separate mixtures of substrate and yeast). However in my plan I stated I will conduct 15 experiments per substrate however this will be too time consuming therefore I will pool my data.
Results table
Above is the table which shows my experimental data gathered in the experiment.. The table shows the volume of CO2 (cm3) produced over time (minutes).
Pooled results table
Above is the table of pooled results. Results that are from my experiments are highlighted in blue, while results that were believed to be anomalous are highlighted in orange. The anomalous results were not included in the sample to create the histograms to ensure that the histograms are accurate and valid.
Graph analysis
The graph shows that a higher frequency of experiments produced a greater amount of C02 gas (14 results from glucose produced a final C02 volume between 45<x<50) while only 4 results of fructose produced C02 volume between 45<x<50 cm3. However it is unclear if there is any significant difference that glucose may be a more suitable substrate for respiration that glucose due to the overlap that occurs in the 40<x<45 and 45<x<50 intervals. Thus I must calculate the Students t test to determine if any significant difference for the amount of C02 produced by the 2 substrates.
By referring to the T value tables, the probability when t=2.98 is equal to p=0.025. Since this probability is greater than the critical value for the null hypothesis to be accepted (p=0.005) I will reject the null hypothesis and accept the hypothesis that glucose produces a larger volume of C02 gas produced than fructose.
The frequency histogram for glucose against maltose indicates that glucose produces more C02 gas from respiration as 14 results fall into the 45-50 cm3 gas produced interval while the highest interval reached by maltose is 35-40 cm3 of C02 gas evolved. This is due to the fact the glucose is a monosaccharide that can be readily diffused into the yeast cell while maltose is a disaccharide and will require to be digested into its monomers by maltase. Thus, due to the speed in which glucose can be transported into the cell than maltose (2x glucose) is accountable for the amount of C02 produced by glucose than maltose.
The frequency histogram for glucose against sucrose indicates that glucose produces more C02 gas from respiration as 14 results fall into the 45-50 cm3 gas produced interval while the highest interval reached by maltose is 20-25 cm3 of C02 gas evolved. This is due to the fact the glucose is a monosaccharide that can be readily diffused into the yeast cell while sucrose is a disaccharide and will require to be digested into its monomers by surcease. Thus, due to the speed in which glucose can be transported into the cell than sucrose (glucose + fructose) is accountable for the amount of C02 produced by glucose than sucrose.
The frequency histogram for glucose against lactose indicates that glucose produces more C02 gas from respiration as 14 results fall into the 45-50 cm3 gas produced interval while the highest interval reached by lactose is 0-5 cm3 of C02 gas evolved. This is due to the fact the glucose is a monosaccharide that can be readily diffused into the yeast cell however yeast lack the enzyme lactase to digest lactose into its monomers so that they can be absorbed for digestion. The only respiration that occurs is due to residual glucose being present in the yeast molecules while in lactose solution to respire.
The frequency histogram for glucose against yeast indicates that glucose produces more C02 gas from respiration as 14 results fall into the 45-50 cm3 gas produced interval while the highest interval reached by yeast is 10-15 cm3 of C02 gas evolved. This is due to the fact the glucose is a monosaccharide that requires no extra cellular digestion and can be easily facilitatively diffused into the yeast cell however the yeast independently cannot respire without substrate (as consequently without any substrate no ATP will be produced for respiration to occur).Thus some C02 is produced as yeast produced C02 in the intervals of 10-15 cm3 due to residual glucose being present in the yeast molecules while which are respired.
The frequency histogram shows that fructose produces C02 gas in the volume ranges of 45-50 cm3. This is due t the fact that fructose is a monosaccharide and can be easily diffused into the cell to respire. However, maltose is a disaccharide which must be digested by maltase into its monosaccharide’s glucose in order to be diffused and respired. The greatest volume of c02 produced by Maltose is in the range of 35-40 cm3 (which is also produced by 4 results of the fructose experiment) thus overlap between the two sets of data occurring. Thus it is not possible for me to graphically deduce whether one substrate produces significantly more C02 gas than another, thus I must conduct the students T test.
By referring to the T value tables, the probability when t=2.98 is equal to p=0.005. Since this probability is greater than the critical value for the null hypothesis to be accepted (p=0.005) I will reject the null hypothesis and accept the hypothesis, thus I can deduce that fructose produces a larger volume of C02 gas during respiration that maltose
The frequency histogram for glucose against sucrose indicates that glucose produces more C02 gas from respiration as 14 results fall into the 45-50 cm3 gas produced interval while the highest interval reached by sucrose is 20-25 cm3 of C02 gas evolved. This is due to the fact the glucose is a monosaccharide that can be readily diffused into the yeast cell while sucrose is a disaccharide and will require to be digested into its monomers by surcease. Thus, due to the speed in which glucose can be transported into the cell than maltose (glucose + fructose) is accountable for the amount of C02 produced by glucose than maltose. Since there is no overlap between the two sets of data one can deduce that fructose produces a larger yield of C02 than sucrose.
The frequency histogram for fructose against lactose indicates that fructose produces more C02 gas from respiration as 5 results fall into the 45-50 cm3 gas produced interval while the highest interval reached by lactose is 0-5 cm3 of C02 gas evolved. This is due to the fact the fructose is a monosaccharide that can be readily diffused into the yeast cell however yeast lack the enzyme lactase to digest lactose into its monomers so that they can be absorbed for digestion. The only respiration that occurs is due to residual glucose being present in the yeast molecules while in lactose solution to respire. Since there is no overlap between the two sets of data I can deduce that fructose produces a greater volume of C02 than Lactose,
The frequency histogram for fructose against yeast indicates that fructose produces more C02 gas from respiration as 5 results fall into the 45-50 cm3 gas produced interval while the highest interval reached by yeast is 10-15 cm3 of C02 gas evolved. This is due to the fact the fructose is a monosaccharide that requires no extra cellular digestion and can be easily facilitatively diffused into the yeast cell however the yeast independently cannot respire without substrate (as consequently without any substrate no ATP will be produced for respiration to occur).Thus some C02 is produced as yeast produced C02 in the intervals of 10-15 cm3 due to residual glucose being present in the yeast molecules while which are respired. Since there is no overlap between the two sets of data I can deduce that fructose produces a greater volume of C02 gas than yeast.
The frequency histogram for maltose and sucrose indicates that maltose produces a greater volume of C02 as 2 experiments have produced c02 in the ranges of 35-40 cm3, while the highest volume of C02 produced by sucrose by 13 reactions is 20-25 cm3 of C02 gas. This is due to the fact that more maltase enzymes may have been present in the yeast therefore maltose could be digested faster than sucrose to form its monomers that can be diffused to be respired by yeast. Since there is no overlap between the two data sets I can deduce that maltose produce a greater volume of C02 than sucrose.
The frequency histogram for maltose against lactose indicates that maltose produces more C02 gas from respiration as 2 results fall into the 35-40 cm3 gas produced interval while the highest interval reached by lactose is 0-5 cm3 of C02 gas evolved. This is due to the fact the yeast contain maltase enzyme which can digest the maltose into its monosaccharide (glucose) that can be readily diffused into the yeast cell however yeast lack the enzyme lactase to digest lactose into its monomers so that they can be absorbed for digestion.
The only respiration that occurs is due to residual glucose being present in the yeast molecules while in lactose solution to respire. Since there is no overlap between the two sets of data I can deduce that maltose produces a greater volume of C02 than Lactose.
The frequency histogram for maltose against yeast indicates that maltose produces more C02 gas from respiration as 2 experiments fall into the 35-40 cm3 gas produced interval while the highest interval reached by yeast is 10-15 cm3 of C02 gas evolved. This is due to the fact yeast can digest the maltose molecule using maltase into is monosaccharide’s (glucose) which diffused into the yeast cell however the yeast independently cannot respire without substrate (as consequently without any substrate no ATP will be produced for respiration to occur).Thus some C02 is produced as yeast produced C02 in the intervals of 10-15 cm3 due to residual glucose being present in the yeast molecules while which are respired. Since there is no overlap between the two sets of data I can deduce that maltose produces a greater volume of C02 gas than yeast.
The frequency histogram for sucrose against lactose indicates that sucrose produces more C02 gas from respiration as 13 results fall into the 20-25 cm3 gas produced interval while the highest interval reached by lactose is 0-5 cm3 of C02 gas evolved. This is due to the fact the yeast contain sucrase enzyme which can digest the sucrose into its monosaccharide (glucose + fructose) that can be readily diffused into the yeast cell however yeast lack the enzyme lactase to digest lactose into its monomers so that they can be absorbed for digestion. The only respiration that occurs is due to residual glucose being present in the yeast molecules while in lactose solution to respire. Since there is no overlap between the two sets of data I can deduce that sucrose produces a greater volume of C02 than Lactose.
The frequency histogram for sucrose against yeast indicates that sucrose produces more C02 gas from respiration as 13 results fall into the 20-25 cm3 gas produced interval while the highest interval reached by yeast is 0-5 cm3 of C02 gas evolved. This is due to the fact the yeast contain sucrase enzyme which can digest the sucrose into its monosaccharide (glucose + fructose) that can be readily diffused into the yeast cell however the yeast independently cannot respire without substrate (as consequently without any substrate no ATP will be produced for respiration to occur).Thus some C02 is produced as yeast produced C02 in the intervals of 10-15 cm3 due to residual glucose being present in the yeast molecules while which are respired. Since there is no overlap between the two sets of data I can deduce that sucrose produces a greater volume of C02 gas than yeast
The frequency histogram between lactose and yeast indicates that all 15 experiments of lactose produced the volume 0f C02 in the 0-5 cm3 range. This is due to the fact that yeast lacks the enzyme lactase to digest lactose into its monomers so that they can be absorbed for digestion, and hence cannot be respired. The only respiration that occurs is due to residual glucose being present in the yeast molecules while in lactose in solution to respire. Yeast produced C02 in the volume range of 10-15 due to residual glucose being used for respiration, as without any substrates yeast cannot respire (due the lack of energy in the from of ATP). Thus, as there are no overlaps in the two sets of data, yeast produced a larger volume of C02 gas than lactose.
Analysis
Mean for pooled results (of each substrate)
Standard deviation for pooled results (of each substrate)
In my plan I predicted a hypothesis that stated that the type pf substrate used will affect the amount of C02 produced, and hence the rate of respiration. This is due to the fact that sugars are needed in order to carry out respiration (due to the requirement of ATP). I predicted that maltose would produce the largest volume of C02 based on the reason that maltose is a disaccharide formed from two glucose molecules. I assumed that since two molecules of glucose will be produced per mole of digested maltose, this will increase the volume of C02 produced by 200%. However, this was not the case as my average scatter graph shows that the sugar fructose managed to produce the largest volume of C02 with the final volume at 45 minutes being 49.7cm3, being followed by glucose with final volume of C02 produced at 45.7cm3. Glucose was followed by maltose at 27.5 cm3, sucrose at 20.2 cm3 and lactose at 0.3cm3. Thus graphically this deduces that the different type of substrates affect the amount of C02 produced (which affects the rate of respiration).
However referring to my average CO2 cm3 gas produced per substrate graph indicates that on average (and referring to the mean table above) that glucose produces the most amount of C02 with 44.21 cm3 gas followed by fructose with a mean production of C02 gas of 38.16 cm3. However, referring to my error bars (where the mean lies in between 90% of the error bar) the profile of the graph can be significantly changed to show that fructose produces the largest volume of C02 while glucose produces less than fructose if we take into account the error bars. This may suggest that external factors such as residual glucose in the yeast may have added to a falsely positive value of C02 gas production. Residual glucose was monitored by using experimental controls, two test tubes one containing substrate only and the other containing yeast solution only. The substrate only control gave me no results, which is expected as substrate will not respire ( as it isn’t a living organism). However the yeast control produced a significant amount of C02 gas (mean C02 produced of 8.93 cm3) by respiring residual glucose, thus residual glucose probably has caused significant positive gains in my results.
However, Fructose produced the greatest volume of CO2 gas due to the fact that the yeast has been adapted to have a larger number of specific carrier proteins for transporting fructose in its membranes when compared to specific carrier proteins for glucose. Fructose and glucose are polar substances, thus they cannot just pass into the cell via lipid diffusion (due to the phospholipid bi layer of the membrane) but must be facilitatively diffused instead. Facilitated diffusion is the transport of substances across a membrane by a trans-membrane protein molecule. The transport proteins are specific for one molecule (for example a carrier protein for glucose will not diffuse a fructose molecule). Molecules are transported down a concentration gradient; hence facilitated diffusion is a passive diffusion process. Therefore pH is an important factor that may be limiting this reaction. The carrier proteins are globular proteins with a tertiary enzymes structure. Enzymes have an optimum pH at which they have the highest rates of reaction. The pH affects the charge of the amino acids at the active site due to the ionic nature of amino acids and this causes the structure of the active site to change As discussed, the carrier proteins are specific to the substrates, and if the carrier protein structure is altered in anyway this may cause the reduction of substrate uptake and consequently reduce the rate of respiration.
Thus in respiration in glycolysis the sugar molecule is split into 2 molecules of pyruvate and thus a net gain of 2 ATP molecules takes place. The process occurs within the cytoplasm of the yeast, and occurs when 2 molecules of ATP are hydrolysed to form ADT + Pi. To get the sugar in a more reactive form 2 phosphate groups are added to it, it is then in the form known as Glyceraldehyde 3-phosphate, this has 6 carbons.
This is further split into two molecules of the 3 carbon sugar, when this is split into two molecules of pyruvate an oxidation reaction takes place and electrons are transferred to NAD and thus the energy which is released from this occurrence is used to join 4 moles of ADP + Pi to form ATP. In the end of this reaction we have a net gain of 2 ATP molecules and further a reduced NAD molecule as well, the reduced NAD goes onto the electron transport chain where it is finally converted into ATP. Thus the fructose/ glucose is required to be in the cell ready for glycolysis so that it can be used to produce ATP. Hence, fructose produced a larger volume of C02 gas than glucose due to the fact that more molecules of fructose were diffused quicker than glucose so that the yeast could be able to respire (and thus produce C02, a bi product of oxidative decarboxylation).
Maltose and sucrose produced less amounts of C02 when compared to fructose and glucose, however this is due to the fact that these sugars are disaccharides that first must be digested by their respective enzymes before they respiration can occur. There may have been a limiting number of extra cellular enzymes, thus the number of digested monomers available was less and hence reduced the amount of sugars available for respiration, decreasing volume of respiration which is indicated by the lesser amount of C02 gas produced. Lactose produced the minimal amount of C02, and this is due to the fact that yeast lacks the lactase enzyme in order to digest lactose to its monomers. Any respiration that did occur was due to residual glucose in the yeast that was being respired.
Evaluation