We shall shape the graphite putty into a cuboid using a ruler to flatten the edges and a knife to cut it into a cuboid of 2cm wide, 2cm high and 15cm long.
We shall clean the surfaces of a pair of small copper plates using sandpaper to rub off any impurities or oxides that may affect our results. These copper plates are attached to each end of the graphite cuboid so that the whole of the cross-sectional area is covered. The copper plates will be connected to the circuit using crocodile clips.
The power source will then be turned on and a current will pass through the graphite putty with a fixed voltage of 3.5V. The current will be measured on an ammeter after it passes through the graphite putty and the measurement will be recorded. We shall use an voltmeter to monitor the voltage across the graphite putty.
Next, we shall turn off the power source and remove the copper plate from one end of the cuboid. A 1cm segment will be cut off from this end so that the length of the cuboid becomes 14cm. The copper plate will be replaced, the power will be switched back on, and the new current will be recorded.
The graphite putty is allowed to cool down for 30 seconds after each measurement because when electrons collide with the atoms of the graphite putty, they produce heat energy. This heat energy would cause the atoms in the graphite putty to vibrate more vigorously which would increase the chances of collision. As a result, the resistance of the graphite putty will increase and make the subsequent measurement inaccurate.
We shall repeat the process for every centimetre from the length of 15cm down to 1cm.
The graphite putty will then be reshaped into a 15cm x 2cm x 2cm cuboid and the whole process stated above will be repeated. We shall performed the experiment three times.
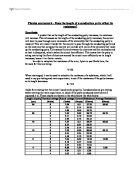
Method 2
The second method involves the use of an ohmmeter in a circuit as shown below:
The graphite putty will be reshaped into a cuboid of 15cm long, 2cm wide and 2cm high and will be connected to the circuit in the same way as it is in the first method (using copper plates and crocodile clips). The ohmmeter has its own power source and passes a current through the graphite putty. The ohmmeter will work out the resistance of the graphite putty and display it on its screen. The reading will be recorded and the length of the graphite putty will be shortened using the same procedure as in the first method.
Since the cross-sectional area of the resistor under investigation (the cuboid) is maintained at a fixed value of 2cm x 2cm = 4cm2 and the resistivity of the graphite putty is known to be 40 x 10-3ohm-metres, we can predict the measurement of resistance (in method 2) using Equation 2. In addition, using Equation 1, we can also predict the measurement of current (in Method 1) since we will use the same power setting on the power pack and we know the resistance of the resistor.
Table 1 in the next page shows the predicted results (in italic) of the investigations.
Table 1: Predicted results of the investigations
Method:
As stated in the plan, except that we did not have time to repeat Method 2 three times.
Safety:
The following are the steps we took to make the investigation safe:
- We used a low voltage to reduce risk of electrocution.
- We did not touch any exposed wires when the power was on.
- We were careful when we cut a segment from the graphite putty.
- We cut the graphite putty on a cutting tile.
Fair Test:
The following are the steps we took to ensure that the investigation was fair:
- We used the same graphite putty for every experiment.
- The width and height of the graphite putty remained constant (width = 2cm, height = 2cm), only the length changed.
- We used the same voltage in every experiment.
- We cleaned the surface of the copper plates to remove any impurities or oxides that may alter our results.
- We covered the whole of the cross sectional area of the graphite putty with the copper plates.
- We performed the experiment in an air-conditioned environment; therefore the temperature was constant.
- We allowed the graphite putty to cool down after each experiment, to prevent an increase in resistance after the current passed through it.
Results and Analysis:
Table 2 in the next page summarizes the results of Method 1 where currents passing through the resistor were measured. For each length, we have included the three individual readings, the calculated average of the three readings, the predicted result as derived in Table 1, and the percent deviation comparing our experimental result to the prediction.
With a quick glance, we notice that the first two experimental results are inconsistent to the rest of the other results. While the rest of the currents we recorded increase as the length of the graphite putty decrease, the current recorded for the length of 14cm was slightly lower than that for the length of 15cm.
Graph 2 illustrates the effect of the length of resistor on the current passing through it. The black line shows the average current obtained from our measurements against the length of the resistor while the red line represents the predicted relationship between the current and the length of the resistor. Both graphs produce upward curves showing an exponential increase in current as the length of the graphite putty decreases. This is because current is inversely proportional to the length of the resistor.
Table 2: Results of Method 1
As shown in Graph 2, our experimental results are in consistence with our predictions as the two curves are fairly close to each other except for the measurements of 1 cm and 2cm. Only one of our experimental results coincides exactly with the predicted results (when the length of the resistor is 9cm). All other results except for the lengths of 14cm, 13cm, 2cm and 1cm have less than 10% error. The largest errors occurred in our last two results, a percent deviation of 19% and 43% when the length of the resistors are down to 2cm and 1cm respectively.
In addition, from Graph 2, we observe that when the length of the graphite putty is between 8cm to 15cm, the effect of length on amount of current flowing through is not that significant. To cut short the resistor by 7cm, almost half of the original length from 15cm to 8cm, an increase of only 0.2A was recorded, that is an average of 0.03A per centimetre. However, for the lengths of 7cm and shorter, the effect of length on current becomes much more noticeable. Each time we cut short the resistor by 1cm, an increase of at least 0.08A was recorded. The shorter the resistor became the more significant changes in current we observed.
Table 3: Comparisons of the two methods of experiment
Table 3 compares the results of our two methods of experiment. The second column in Table 3 shows the resistance of the graphite putty obtained from Method 1. Equation 1 is used in the calculation:
Fixed voltage (3.5V)
Resistance = -----------------------------
Average current
The third column in Table 3 shows the results of Method 2 where resistance of the graphite putty cuboid was measured directly using an ohmmeter. The fourth column shows the predicted results as derived in Table 1. Last but not the least, in columns five and six we calculated the percent deviation of the experimental results against the predictions for Method 1 and Method 2 respectively.
In Graph 3, we plot resistance against length for the two experimental methods and the prediction. The red line represents results from Method 1; the blue line represents results from Method 2; and the black line shows the prediction. All the lines show a definite decrease in resistance as the length of the putty decreased. We know that resistance is directly proportional to length of the resistor, therefore the black line, which shows the predicted results, is a straight line.
As shown in Table 3 and Graph 3, the results we obtained from Method 2 are very close to the predicted results. The actual differences between the experiment and prediction vary from -0.1Ω to +0.3Ω. The largest error occurs when the length is 10cm. On the other hand, some of the results from Method 1 are hugely different from the predicted results, the actual difference range from –0.64Ω to +2Ω. The largest difference occurs when the length is 13cm.
As shown in Graph 3, it appears that our experimental results, especially Method 1, are more accurate for shorter lengths. However, in terms of percent deviation from prediction, Method 1 has a range of -9% to 76% error, while it is -2% to 20% for Method 2. In Method 1, four of our results give over 10% error. These are 14%, 15%, 23% and 76% for lengths 14cm, 13cm, 2cm and 1cm respectively. In Method 2, only two of our results give an error of 10% or over. These are 10% and 20% for the lengths 2cm and 1cm respectively. Therefore, in both experimental methods, the largest error occurs when the resistor was shortened to 1cm. This shows that the shorter the resistor, the more important accuracy in length becomes. Our experimental results are generally more accurate for the longer lengths as a slight inaccuracy in length would not affect our results in the same big way as for shorter lengths.
Evaluation:
Our results from Method 1 are not as accurate as the results from Method 2. I think this was because we had not shaped the graphite putty properly into a cuboid, as Method 1 was the first experiment we performed. Subsequently, we had more experience in shaping the cuboid, therefore more accurate results. If we are to repeat Method 1 again, I am sure we shall get more accurate results.
Comparing the two methods of experiment, Method 2 is definitely in favour. The setup is relatively simpler: no power source is required, less connection in the circuit means less source of error. The measurements are straightforward: the ohmmeter gives the reading of resistance directly, no calculation is needed. Therefore, if we were to repeat the investigation again, we would use Method 2 only. It is also important to repeat the experiment three times for reason of fair test which we did not have time to perform in this investigation. However, Method 1 will be essential if an ohmmeter is not available.
As discussed in the Results and Analysis section, the graphite putty cuboid under investigation had larger errors when its length was 2cm or shorter. One reason is that the shorter cuboid is simply more sensitive to errors in length than the longer ones. Assuming that we have a cuboid with perfect even sides, an error of 0.1cm in length will result in a 1% error in resistance for a 10cm long cuboid, but it would cause a 10% error in resistance for a 1cm long cuboid. Therefore, it is very important that we cut the cuboid exactly to the desired length especially when it is short.
When the cuboid is long it is hard to shape it perfectly; the sides may be uneven causing some of the errors. Perhaps, we could produce more evenly shaped cuboids by melting the putty and pouring it into a mould. Or, we could use ready-made graphite putty cuboid from an industrial manufacturer. A manufacturer should have good quality control on their products. We had to reconstruct the cuboid three times by hand, therefore the cuboid will have deviations in its dimensions. These deviations would affect our results.
Another reason of error in a longer resistor could be that heat energy produced is higher since the resistor is longer and electrons flowing through it collide with more atoms. This heat energy causes the atoms to vibrate more vigorous thus increase the resistivity of the graphite putty and give rise to errors. If I were to repeat this experiment again, I would monitor the temperature of the graphite putty because a change in temperature would change the resistivity of the substance. I would monitor the temperature with a thermometer and only perform the experiment when the graphite putty is at a certain temperature so that the resistivity is the same.
To improve the experiment, I would use acid to clean the surface of the copper plates because this would remove all impurities and oxides from the surface of the copper plates. Using sandpaper to clean the surface of the copper may not have removed all of the impurities. These impurities and oxides may have increased the resistance slightly.
Conclusion:
The results I obtained are accurate enough for me to make the conclusion that the length of a resistor does affect the resistance of the resistor. An increase in length of the resistor results in an increase in resistance because there are more atoms for the electrons to collide with. This supports my original prediction that the resistance will increase if the length of the resistor increases. Furthermore, resistance of a resistor is directly proportional to its length. Doubling the length doubles the resistance because there are twice as many atoms; so there are twice as many collisions. Halving the length would halve the number of atoms in the resistor resulting in half the number of collisions; therefore resistance is halved.
By Tsun-Kidd Wong, 11JI