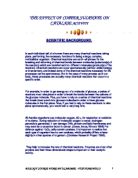
The effect of Copper Sulphate concentration on Catalase activity on Hydrogen Peroxide.
The effect of Copper Sulphate concentration on Catalase activity on Hydrogen Peroxide
Aim:
The aim of my investigation is to explore the effects of chemical inhibitors upon the rate of reaction. The reaction I am going to focus on is the breakdown of Hydrogen Peroxide by the enzyme Catalase. Such reaction is represented by the following equation:
2H202 (aq) ?2H20 (l) + 02 (g)
Hydrogen peroxide, H2O2, is a colourless, syrupy liquid that is a strong oxidising agent and, in water solution, a Iak acid. It is miscible with cold water and is soluble in alcohol and ether. Although pure hydrogen peroxide is fairly stable, it decomposes into water and oxygen when heated above about 80°C; it also decomposes in the presence of numerous catalysts, e.g., most metals, acids, or oxidisable organic materials. A small amount of stabiliser, usually acetanilide, is often added to it. Upon the bases of this information, collected from the source (www.encyclopedia.com) and a pilot experiment, which I carried out, I decided that the latter could function as a suitable substrate for the reaction I am going to be studying.
Catalase is an enzyme: enzymes are biological catalysts that speed up the rate of a reaction by loIring the activation energy needed to initially break the bonds that hold the reactant molecules together. Catalases are some of the most efficient enzymes found in cells. Each catalase molecule can decompose millions of hydrogen peroxide molecules every second (200,000 catalytic events/second).
Catalase is encountered in most living tissues, and it is present in nearly all the peroxisomes of nearly all aerobic cells, serving to protect the cell from the toxic effects of hydrogen peroxide by catalysing its decomposition into molecular oxygen and water. I shall describe in more detail the nature of this process: our cells are constantly supplied with oxygen. The latter is a vital molecule for our body but it has also got some dangers; one of them is that it is easily converted into reactive compounds. Inside our cells, electrons are continually shuttled from site to site by carrier molecules, such as carriers derived from riboflavin and niacin. If oxygen runs into one of these carrier molecules, the electron may be accidentally transferred to it. This converts oxygen into dangerous compounds such as super oxide radicals and Hydrogen Peroxide, which can attack the delicate sulphur atoms and metal ions in proteins.
The enzyme is composed of four identical subunits, each with its own active site buried deep inside. The Iron ion is gripped at the centre of a disk-shaped Haem group. Catalases, due to the fact that they have to fight against reactive molecules, are unusually stable enzymes. The chains interIave, locking the entire complex into a proper shape.
I managed to encounter, along with the information I displayed a figure representing the structure of catalase: (http://personal.nbnet.nb.ca/trevgall/biology/quaternary_structure.jpg)
Enzymes have features, which are called active sites. The latter, are regions of the enzyme molecule, more specifically clefts or depressions, to which another molecule or number of molecules can bind to. These, take the name of substrates. The active site's shape allows the substrate to fit perfectly, and to be held in place by temporary bonds, which form betIen the substrate and some of the side chains of the enzyme's amino acid. Each enzyme is specific to a certain substrate, in our case the enzyme catalase whose active sites can only allow Hydrogen Peroxide molecules to bind. This is because each active site has a specific shape, and only one type of substrate has a suitable shape to be able to fit into the active site. This hypothesis takes the name of the "lock and key model". To be more detailed, the substrate- binding site consists of an indentation on the surface of an enzyme molecule that is complementary in shape to the substrate, this relationship takes the name of geometric complementarity. Moreover, the amino acid residues that form the binding site are arranged to interact specifically with the substrate in an attractive manner (electronic complementarity). Molecules that differ in shape or functional group distribution from the substrate cannot productively bind to the enzyme.
There had been hypothesis that the active site was a rigid structure, lacking of malleability, but it has been discovered that it can actually alter its shape slightly in order to perfectly fit around the substrate. This secondary hypothesis, took the name of " induced fit theory".
It is important to specify that the enzyme does not form a chemical bond with the substrate. After the reaction, the products are released and the enzyme returns to its normal shape. Because the enzyme does not form chemical bonds with the substrate, it remains unchanged. As a result, the enzyme molecule can be reused. Only a small amount of enzyme is needed because they can be used repeatedly.
http://faculty.clintoncc.suny.edu/faculty/Michael.Gregory/files/Bio%20101/Bio%20101%20Laboratory/Enzymes/Enzymes.htm
Prediction & Scientific explanation:
In my aim I introduced the concepts of enzymes and described the chemistry behind the catalysis reaction, as Ill as displaying some information about the reactants involved in the breakdown of Hydrogen Peroxide. I did so in order to be able to focus on the concept of inhibitors in this part of the investigation.
Chemical inhibitors are molecules, that have a shape and structure which is very much resembling to the substrate's one. This resemblance allows the inhibitor to easily bind to the enzyme's active site, making it impossible for the substrate to bind to the active site.
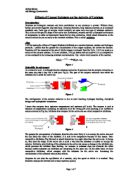
Very common chemical inhibitors are solutions, which contain metal ions, such as the one I am using: copper sulphate. In my case the copper ions act as inhibitors preventing the Hydrogen Peroxide molecules (former substrates), to bind to catalase's active sites. Before I go into more detail into the explanation of this reaction I'm going to distinguish the various types of inhibition, in order to establish which one would be present in my experiment.
There are two main types of inhibition: competitive inhibition and non-competitive inhibition. For the first type of inhibition, the fact that enzymes combine briefly with their reactants makes them susceptible to inhibition by uncreative molecules that resemble the substrate. The inhibiting molecules can combine with the active site of the enzyme but tend to remain bound without change, blocking access by the normal substrate. As a result, the rate of the reaction slows. If the concentration of the inhibitor becomes high enough, the reaction may stop completely. Inhibition of this type is called competitive because the inhibitor competes with the normal substrate for binding to the active site. (Diagram obtained from the following source) http://metallo.scripps.edu/PROMISE/CATALASE.html
X-axis= time
Y-axis= volume of gas produced
In non-competitive inhibition the inhibitors interfere with enzyme-catalysed reactions by combining with enzymes at locations outside the active site. These inhibitors, rather than reducing accessibility of the active site to the substrate, cause changes in folding conformation that reduce the ability of the enzyme to loIr the activation energy. Because such inhibitors do not directly compete for binding to the active site, their pattern of inhibition is called non-competitive.
Inhibition by copper sulphate falls under the non-competitive category. I will now go into further detail in how the latter process happens
X-axis= time
Y-axis= volume of gas produced
In non-competitive inhibition, a molecule binds to an enzyme but not at the active site. The other binding site is called the allosteric site (allo - other and steric -structure or space). The molecule that binds to the allosteric site is an inhibitor because it causes a change in the 3-dimensional structure of the enzyme that prevents the substrate from binding to the active site. In cells inhibition usually reversible; that is the inhibitor isn't permanently bound to the enzyme. Irreversible inhibition of enzymes also occurs, due to the presence of a poison. For example, penicillin cause the death of bacteria due to irreversible inhibition of an enzyme needed to form the bacterial cell wall. In humans, hydrogen cyanide irreversibly binds to a very important enzyme (cytochrome oxidase) present in all cells, and this accounts for its lethal effect on the body.
Catalase being an enzyme is also a protein and therefore it is composed of several structures including a 3D tertiary structure. This is the section of the enzyme, which I am going to focus on, because it is the one, which gets affected by the inhibitor ions. At the centre of the structure there is an arrangement called the porphyrin ring, which is responsible for carrying out the reaction. At the centre of this ring an iron Haem-group is located, Adding copper sulphate displaces the iron from the centre of the ring, as it has a higher stability constant (K stab). Thus, the iron which catalyses the overall reaction is removed and it cannot proceed. As Ill as that the copper (2+) ions in the copper sulphate solution combine with the thiol groups in enzymes, breaking the disulphide bonds that give the enzyme coil its shape. This results in ripples of distortion across the molecule to the active site, which is then altered so that the substrate no longer fits into it.
Hypothesis: The copper sulphate solution will inhibit (slow down) the rate at which Catalase breaks down Hydrogen Peroxide. The concentration of Copper sulphate is inversely proportional to the rate of reaction.
Null Hypothesis: The copper sulphate solution will have no effect on the rate of reaction betIen Hydrogen Peroxide and Catalase. As the copper sulphate concentration is altered, the rate of reaction will remain constant.
http://www.finishing.com/74/03.html
I therefore predict, that as the I increase the copper sulphate concentration, the rate at which the Catalase breaks down the Hydrogen Peroxide will also slow down. Amongst the various concentrations I am going to use, there will be one that will be composed 0% of distilled water. I predict that that will be the sloIst rate. This is because the high concentration (pure state) 1 mole, of copper ions, will act on a large number of Catalase molecules, displacing the Iron Haem group located at the centre of the porphyrin ring, and a large quantity of copper (2+) ions will be combining with the thiol groups in the enzyme in such way to break the disulphide bonds and altering the structure of the enzyme, and more specifically the shape of its active sites, preventing any Hydrogen Peroxide molecules from binding to them.
As the Copper sulphate concentrations get loIr, there will be a smaller number of copper ions roaming free in the solution, which means that less Iron Haem groups will be displaced, and that the disulphide bonds of a smaller number of Catalase molecules will be broken. Overall this results in an increased rate of reaction, because there will be more Catalase molecules in optimum conditions to be able to catalyse the breakdown of the Hydrogen Peroxide molecules.
As I mentioned in the methodology for my experiment, I will be displaying my results on a graph, which will facilitate me in drawing a conclusion from the latter.
If I was to explain the course of the reaction in graphical terms, I expect that for the loIst copper sulphate solutions, the curves representing the results will be steepest, showing a fast rate of reaction.
For the higher concentrations, up to copper sulphate in its pure state, I expect the curves to be less steep, showing a sloIr rate of reaction.
To analyse further the single graphs, I also expect the curves to be reaching a plateau, at which the rate has reached a constant value and no longer increases or decreases, and proceeds constantly until the reaction stops. The reason for this pattern is generally attributed to the fact that one of variables in the experiment becomes a limiting factor; in our case a reasonable hypothesis could be that the enzyme eventually breaks down all the substrate. As the Hydrogen Peroxide molecules gradually are all broken down, the curve reaches a plateau, and the rate does not increase any further, until when there is no substrate left and the reaction ends. Even if more enzyme molecules are added, the rate of reaction will not increase.
HoIver it might take several minutes for this to happen, and since the lack of time only alloId us to time our reactions for 3 minutes each, it is likely that our graphs won't be represent this section of the reaction.
Variables:
Control variables:
o pH - pH affects the three-dimensional structure of all enzymes. Enzymes are made up of amino acids. Each amino acid has a -NH2 group and a -COOH group, as Ill as certain amino acids that have an extra -COOH group (e.g. aspartate) or an extra -NH3+group (e.g. asparagine). pH is ...
This is a preview of the whole essay
HoIver it might take several minutes for this to happen, and since the lack of time only alloId us to time our reactions for 3 minutes each, it is likely that our graphs won't be represent this section of the reaction.
Variables:
Control variables:
o pH - pH affects the three-dimensional structure of all enzymes. Enzymes are made up of amino acids. Each amino acid has a -NH2 group and a -COOH group, as Ill as certain amino acids that have an extra -COOH group (e.g. aspartate) or an extra -NH3+group (e.g. asparagine). pH is all about concentration of H+ ions. At low pH and high H+ concentration the predominant forms of these groups will be -COOH and -NH3+ or the "protonated forms". At neutral pH the predominant forms will be -COO and -NH3+. At high pH the predominant forms will be -COO- and -NH2. HoIver the actual pH at which each group becomes ionised depends on the particular amino acid and also the environment in which the enzyme is found. The usual way of expressing this is the pK value: this pK is the pH at which half of the groups are ionised. Interactions betIen positive and negative charges are a very important part of what holds the structure together in an enzyme. These links are known as salt links, salt bridges or electrostatic interactions and involve a + to - attraction. Changing the pH therefore alters the properties of these salt bridges. Even a small shift away from optimum pH might mean one of these salt bridges is affected and therefore the shape and activity and stability of the protein will also be affected.
(http://metallo.scripps.edu/PROMISE/CATALASE.html)
From a source which I investigated (www.enzymes.co.uk) I found out that the optimum pH for Catalase is 7, which means that the overall pH of the solution has to be neutral. I was concerned though, because the enzyme catalase is encountered in slightly alkaline environments such as blood and liver. I hence assumed that the value for the optimum pH of the enzyme had to be in betIen 7 and 8. the reason why I didn't assume it would take a higher value is because such environments are only slightly alkaline, usually of value betIen 7 and 8. From a different source (The fundamental Biochemistry book), I discovered that the value fell nearer to 7 than 8, which justifies my choice of the pH 7 buffer solution, to use in my experiment.
o Temperature - as the temperature at which the reaction takes place is increased, the rate of reaction will increase up to a point. From this point the rate of reaction will decrease to a point at which it will be zero. At low temperatures the reaction will take place slowly, for the reason that the molecules are moving slowly. This means substrate molecules will not collide with the active site very often, so the substrate and enzyme rarely bind. As the temperature of the reaction is increased, the kinetic energy is increased so the molecules move around faster, and therefore collisions are more frequent. When they do collide, they collide with more energy, making it easier for bonds to be broken so that the reaction can take place. As temperature continues to increase, so does the speed of the molecules. HoIver, at a certain temperature, being slightly different for each enzyme, the structure of the enzyme molecule starts vibrating too violently for the bonds holding the molecule together, so some of the bonds begin to break, especially the hydrogen bonds. The enzyme molecule begins to deform and lose its shape, so the substrate molecule can no longer fit into the active site. The enzyme is said to be denatured.
A water bath can be used to maintain a constant temperature throughout the reaction. The reactants are put in the water bath for a minute to achieve equilibrium. The Conical flask should not be hand held. This would increase the temperature inside the conical flask, which would cause the oxygen gas to expand and move at a quicker rate into the measuring cylinder. The results would then be inaccurate.
Using a temperature of 35°C means that the reaction is at its most efficient temperature, therefore larger volumes of gas will be produced (if it is not inhibited). Large volumes of gas are easily measured accurately. It will be easier to differentiate betIen the inhibited reaction and the uninhibited reaction.
After a pilot experiment which I have previously described, my results show that the temperature at which the rate of reaction is at its highest is 35 C, after crossing such temperature boundary, It is possible to notice that the reaction starts to slow down.
This variable must be kept constant in order to abide by the fair test criteria.
o Concentration of enzyme -at low concentrations of the enzyme, there are more substrate molecules than enzyme molecules to catalyse the decomposition. This means that all the active sites are filled with substrate molecules, and there are substrate molecules 'waiting' for an empty active site to bind with, so there will be a fairly low rate of reaction. At higher concentrations, there are more active sites available, so there are more catalytic events/second, so the rate of reaction will increase. Doubling the number of enzyme molecules will double the number of active sites available for the substrate to bind with, therefore a doubling of the rate of reaction up to a certain point. HoIver, as higher concentrations of enzyme are used, over half the substrate molecules will be bound to enzymes, so the rate of reaction will not double with enzyme concentration, but the reaction will still speed up. At a certain point of enzyme concentration, the reaction will not get faster, even if more enzyme is added, because all the substrate molecules will be bound to the active sites of enzymes potato tubes of the same length (5 cm) and diameter (0.5 cm) will be used for each experiment. This is to maintain the enzyme concentration fairly constant throughout the investigation. If potatoes of constant mass are used, the catalase concentrations will be roughly equal, which would make our experiment a fair test.
The Rate of the reaction is directly proportional to the number of collisions, which is increased by the use of more of the enzyme.
This variable must be kept constant in order to abide by the fair test criteria.
o Time length for which results are recorded - The results will be recorded for a period of time of 3 minutes. This time limit will be confirmed by the trial experiment.
The initial rate of reaction is the most valuable part of the reaction for comparison, because after a while the rate of reaction slows down, the reason why I are going to record results for such an extended period of time, is because our pilot experiment shoId us that in some cases there are no visible results before the first 20-30 seconds, and if I decreased the time to the initial rate of reaction time (around 10 seconds), it could be possible that no results are obtained.
This variable must be kept constant in order to abide by the fair test criteria.
o Constant concentration of Substrate (hydrogen peroxide) - if more substrate is added, the enzyme cannot work any faster as it is all being used. The substrate molecules are 'queuing up' for an active site to become vacant. The enzyme as substrate concentration increases, the initial rate of reaction also increases. This is again obvious, as the more substrate molecules there are around, there more often an enzyme's active site can bind with one. HoIver, the more the substrate concentration there is, keeping enzyme concentration constant, there comes a point where every enzyme active site is working continuously. Even if more is working at its maximum possible rate, known as Vmax.This can be achieved by using the same equipment (the volume of the measuring cylinder may vary slightly from another). To measure out the solutions a pipette could be used for a good degree of accuracy.
This variable must be kept constant in order to abide by the fair test criteria.
o The Volume of the equipment - The same equipment should be used. Apparatus often varies slightly in volume and performance rate. For example, the same measuring cylinder should be used because the ease at which gas can enter the cylinder varies (performance rate), and also the graduations may vary slightly.
This variable must be kept constant in order to abide by the fair test criteria.
Independent variable:
o Concentration of copper sulphate solutions-The varying concentrations can be set up and adjusted by diluting the pure copper sulphate solution with distilled water. The reason why I use distilled water is because normal water contains a wide variety of minerals, and if involved in the reaction, it would be very likely to alter the solution's pH. Such operation will be carried out with the use of a pipette.
Dependant variable:
o Production of oxygen over time- With the use of a measuring cylinder I will be able to monitor the amount of oxygen gas produced over time. The graduated cylinder will be placed upside down in the water bath and will be completely filled with water. As the reaction begins taking its course oxygen gas will start bubbling through the tube, decreasing its water level. The space not occupied with water, will then be visible, and the amount of gas easily calculated.
Pilot experiment:
I carried out a pilot experiment before planning the experiment, which I described in this investigation. The reason for doing so was to establish what value certain variables had to assume (such as surface area and optimum temperature). More specifically I investigated which surface area would be more suitable for the potato tube to assume, and at what temperature the reaction should be carried out. I carried out an experiment to see which would be an optimum surface area, and made exploited some work on temperature, which I had done in the past.
Table displaying the production of oxygen gas with varying enzyme surface areas:
Surface area 1
Surface area 2
Surface area 3
Surface area 4
Time (seconds)
Volume (ml)
Volume (ml)
Volume (ml)
Volume (ml)
60
9.0
8.0
8.5
9.5
20
0.0
1.0
9.0
1.0
80
2.0
3.0
1.0
5.0
240
4.0
6.0
3.0
8.0
300
6.0
8.0
5.0
20.0
360
7.0
9.0
6.5
22.0
420
9.0
9.5
8.0
24.0
480
20.0
20.0
9.5
25.0
540
21.0
22.0
22.0
26.0
600
22.5
23.0
24.5
27.0
720
23.0
24.0
25.0
29.0
780
24.0
25.0
28.0
33.6
Key:
Surface area 1= 1 potato tube measuring 5 cm
Surface area 2= 2 potato tubes measuring 2.5 cm each
Surface area 3= 4 potato tubes measuring 1.25 cm each
Surface area 4 = 8 potato tubes measuring 0.625 cm each
For this experiment I observed the rate at which Catalase broke down Hydrogen Peroxide when the potato tubes had different surface areas. As it is possible to notice from our results, the larger the surface area will be the larger the volume of oxygen given off will be. This is because a larger surface area provides more catalase molecules, which speed up the rate of reaction. Consequently to this experiment I decided which surface area our potato tubes should take, so which size potato borer I should use.
I also used the results for an experiment that I had carried out in the past to determine at which temperature it was best to carry out my experiment. The aim of the investigation was to observe how the rate at which Catalase breaks down Hydrogen Peroxide with varying temperatures.
Table to represent the volume of oxygen given off, at different temperatures:
Temperature (°C)
Experiment N°1
No. Of oxygen bubbles given off
Experiment N°2
No. Of oxygen bubbles given off
Average No. Of oxygen bubbles given off
20
8
7
8
30
2
4
3
35
9
7
8
50
6
4
5
From the experiment I had carried out it is clear that the temperature at which the reaction rate is he fastest, is 35? C. This is because after 40 the amount of heat is excessive, and the excess energy causes the hydrogen bonds to vibrate too violently and break, altering the structure of the enzyme molecule. Consequently to this experiment I decided at what temperature I was going to carry out my investigation.
Apparatus:
Apparatus nomenclature
Use
Reasoning for choice
Black marker
To mark the test tubes with appropriate names
To distinguish the various solutions, since at times some of them have same colours.
Test tubes
To contain the solutions, before the reaction, or during the course of it.
The solutions have to be preserved in an enclosed environment, so that they do not react with any other element.
Delivery tube
It is attached onto the bung placed at the open end of the test tube.
It's a practical way of allowing the oxygen produced, to be collected in the measuring cylinder.
Bung
It is plugged onto the open end of the test tube.
It is used to stop any oxygen being released out of the test tube.
Clamp x2
One is used to hold up the measuring cylinder and the other one to prevent the syringe from tipping over.
To avoid spillings that would interfere with the good exit of my experiment.
Test tube rack
To contain the test tubes
I used it to maintain the test tubes in place, in an orderly manner.
Graduated syringe x2
0 ml
One is for injecting the Hydrogen Peroxide into the test tube at the start of the reaction; the other one is used to mix right amounts of other solutions.
To make sure that the hydrogen peroxide doesn't make contact with the other reactants before the right apparatus is set up for the counting of the gas produced. The other syringe is used to measure for example, the amount of distilled water to inject into the copper sulphate solutions.
Stopwatch
To measure the length of time of the reaction, and also to measure the length of time of the acclimatisation process undergone by the 3 test tubes containing the reactants, and the beaker which functions as the environment in which the reaction is happening. The accuracy of the stopwatch was to half a second.
The test tubes containing the reactants are inserted into the water bath set at 35 C, so that the solutions temperature rises to the one in the water bath, the same is carried out with the beaker. This process has to be undergone for a specific length of time, measured by the stopwatch.
Hydrogen peroxide solution
20%
It is put in a test tube and acclimatised before making it react with catalase. The concentration of the Hydrogen Peroxide was 20%
It functions as the substrate in the catalysis reaction. I decided to study catalase, and since enzymes are specific, Hydrogen Peroxide is the only substrate that can fit into catalase's active sites.
Buffer solution (pH 7)
It is put in a test tube and acclimatised before mixing it with the potato tubes and the other solutions
It is used to maintain the pH of the reaction constant at 7 throughout, which is the optimum pH for the reaction involving catalase.
Potato
It is cut into tubes, and mixed with the buffer solution and the various copper sulphate concentrations before being acclimatised.
It functions as the enzyme during the reaction, because potato contains catalase
Potato borer
mark 7 0.7 mm
It is used to cut the potato into tubes of constant diameter and length. The diameter of the potato borer was 0.7 mm
The tubes have to be of roughly same sizes so that the catalase concentration isn't altered throughout the experiment.
Cutting tile
The potato tubes extracted with the potato borer are then cut to the right size on the cutting tile.
Used not to stain or affect other parts of the working environment.
Knife
It is used to cut the potato tubes to the right length.
It provides an accurate way of cutting the potato
Ruler
It is used to measure the length of the potato tubes.
To make sure that they are all the same length.
Measuring beaker x2
250 ml
One is filled with water and acclimatised, the other one is used to measure with the aid of a syringe also, amounts of solutions.
The test tube containing all the reactants will be inserted in one of the beakers before the start of the reaction, the water at 35 C contained in the latter will provide an environment with a temperature superior to the one of the surroundings (room temperature 20 C)
Large bowl
It will be filled with water and during the reaction it will contain the measuring cylinder upside down.
It is used so that the oxygen produced by the reaction can pass through the delivery tube, which is submerged into the water contained in it.
Conical flask
It contains solutions that are used during the course of the experiment
I used mine to keep the buffer solution in a safe place.
Water bath
It will continuously heat water at a specified temperature, in my case 35? C.
I insert the test tubes and beakers containing the reactants that I want to acclimatise into the water bath and leave them in there for a period of 3 minutes. After such time the temperature of the solutions (reactants) will be 35 ?C
Goggles
They are worn throughout the course of the experiment.
To prevent harmful substances such as hydrogen peroxide and copper sulphate entering in contact with my eyes.
Lab coat
To be worn throughout the course of the experiment
To protect my clothing from spillages and stains
Copper sulphate solution 1 mole
It is used as one of the reactants in our experiment. Various concentrations of it will be reacted with the other solutions.
This solution contains metal ions that work as inhibitors on the catalysis reaction. Our aim is to investigate in detail the exact effect of these ions on the course of the reaction.
Pipette
To measure small amounts of solutions.
For small amounts of solutions it is more practical and easy to use a pipette instead of a syringe.
Distilled water
To be introduced into the copper sulphate solutions to create different concentrations.
I aim to investigate how different concentrations of copper sulphate solution affect the rate of the catalysis. I used distilled water because???
Thermometer
To measure the temperature of the surroundings (beaker containing water at 35? C)
To make sure that the temperature of the surroundings is not altered during the course of the
Measuring Cylinder 60 ml
It is filled with water and put placed upside down in the large bowl, over the delivery tube, so that the oxygen produced by the reaction is collected inside it.
The tube is completely filled with water up to the top, so that as more gas is collected the level of water will go down, and the volume occupied by the oxygen is easily calculated by looking at the scale on the cylinder.
Method:
I shall now, describe the procedure, which I folloId to carry out the experiment:
* From a fresh potato I extracted, with the use of the potato borer, several tubes of constant diameter and length (0.5 cm diameter, 5 cm length), I decided after a pilot experiment, that these measurements would give a give a good set of results, showing that the concentration of catalase in those tubes is high enough (to give clear results).
* With the use of a knife (on the cutting tile) and a ruler I made sure that the tubes measured exactly 5 cm, any excess length would be cut off.
* I promptly inserted the tubes in a beaker containing water to preserve them before the start of the reaction; meanwhile the rest of the apparatus was being set up.
* Before setting up any further apparatus I prepared the copper sulphate concentrations. I decided that 5 concentrations would have been enough to show a clear pattern to the results. I filled a beaker with distilled water (?), and put equal volumes of copper sulphate solution into 5 test tubes. I then added different amounts of distilled water with the use of a pipette and a syringe:
o For the first concentration I used 1 mole of copper sulphate in its pure state,
o For the second one I used 0.75 moles of copper sulphate and diluted it with distilled water until the volume of the solution was the same as for the first concentration.
o For the third concentration I used 0.5 moles of copper sulphate and the rest distilled water to maintain constant volumes
o I carries out the same process with 0.25, 0.125 moles of copper sulphate
o For my last experiment I didn't use copper sulphate solution at all, so the reaction didn't get inhibited.
* I then extracted 10 ml of Hydrogen peroxide from its container, with the use of a syringe, and kept it inside it. I clamped the latter firmly and attached it to the bung; meanwhile I prepared the solutions to put in the test tube, which the bung would plug onto. I also filled 4 other test tubes each with 10 ml of Hydrogen Peroxide, which I would later use for the remaining concentrations.
* I then extracted from the conical flask containing buffer solution at pH 7, 10 ml of the solution and inserted it into a test tube ( which I would use for my first concentration), I also filled 4 other test tubes each with 10 ml of buffer solution for the remaining concentrations
* I put the 3 test tubes containing: Hydrogen Peroxide, potato in water, and copper sulphate solution, and a beaker containing water into the water bath to acclimatise for 3 minutes. I measured such time with the aid of the stopwatch.
* Before I inserted them into the water bath, I wrote the name of the solution they contained on the outside surface of the test tube, in order to recognize the solutions. Some have similar colours i.e. Hydrogen Peroxide and the Buffer solution, and it is easy to get confused.
* Meanwhile the test tubes and the beaker Ire acclimatising, I set up the rest of the apparatus: I connected the delivery tube to the bung, filled the measuring cylinder with water and turned it upside down, making sure the delivery tube was under it so that the oxygen produced by the reaction would have been visible when bubbling through the cylinder.
* After the 3 minutes had gone by I took the solutions out of the water bath and inserted the potato, the copper sulphate solution and the buffer solution into the same test tube. I inserted the test tube into the beaker that had been acclimatised, plugged the bung onto its open end and attach the syringe filled with Hydrogen Peroxide onto the bung. I didn't mix the Hydrogen Peroxide in with the other solutions straight away, because it would have immediately triggered the reaction without giving us the time to monitor it.
* I then injected the Hydrogen peroxide into the test tube containing the other solutions and started timing the reaction and monitoring the production of oxygen gas. I decided to monitor the reaction for 2 minutes, after which I would throw away the mixture contained in the test tube.
* I repeated the same process, including acclimatisation one, for all the concentrations and repeated each concentration 3 times.
* I then recorded my results into a table in order for me to be able to produce a graph.
Diagram of the apparatus:
Risk assessment:
Apparatus
How can it be dangerous
How to prevent
Hydrogen peroxide
It is a harmful and irritant substance, if it gets in contact with the skin, it will react with it bleaching its colour. If ingested it could cause serious damage to our internal organism.
It is vitally important that goggles are worn throughout the experiment, which would prevent the solution from entering in contact with the eyes, which are a very delicate part of our body and likely to be irreversibly damaged.
In case any contact with the solution is made, rinse the affected part of the body with fresh water.
Copper sulphate
It is a harmful substance, although not as harmful as Hydrogen peroxide, it is best not for it to enter in contact with any part of the body. It also stains cloth, being a compound of a transition metal ( blue colour), and this often happens through spillages
Iaring goggles will help prevent the solution from entering your eyes, also Iaring a lab coat will prevent the solution from staining your clothes in the case of a spillage
Beakers, test tubes (glass equipment)
In the event that they break or are dropped, they would scatter an enormous quantity of glass pieces and splinters, if they break when containing one of the harmful solutions in them they would also scatter the solution everywhere turning the working station into a high-risk area
It has to be ensured that the glass equipment is safely positioned on a stable support i.e. test tube on a test tube rack, beakers and conical flasks far from the edge of the tables. In case of any of the equipment breaking, the workstation should be cleared straight away making sure that no glass pieces remain on the table.
Needles
In the containers where syringes are obtained, there needles lying around. If the container is not handled with care it is possible that one of the needles penetrates the skin, creating the risk of an infection.
The container has to be handled with care, and in case of the needle entering the skin, the wound should be disinfected immediately and bandaged so not prevent any more germs from entering the wound
Tables representing the volume of oxygen given off by the breakdown of Hydrogen Peroxide by catalase, in varying copper sulphate concentrations.
M concentration
Experiment 1
Experiment 2
Experiment 3
Average
Standard Deviation
Coefficient of variation
Time (s)
Volume
(ml)
Volume
(ml)
Volume
(ml)
Volume (ml)
Volume
(ml)
%
30
1.0
0.5
9.5
0.3
0.8
7.4
60
2.5
1.5
1.0
1.7
0.8
6.5
90
3.0
3.0
2.5
2.8
0.3
2.2
20
3.5
4.0
3.5
3.7
0.3
2.1
50
4.5
4.5
4.5
4.5
0.00
0
80
5.0
5.5
5.5
5.3
0.3
.9
0.75 M concentration
Experiment 1
Experiment 2
Experiment 3
Average
Standard Deviation
Coefficient of variation
Time (s)
Volume (ml)
Volume (ml)
Volume (ml)
Volume (ml)
Volume
(ml)
%
30
0.5
1.0
1.5
1.0
0.5
4.5
60
2.5
2.5
3.0
2.7
0.3
2.3
90
3.0
3.5
4.0
3.5
0.5
3.7
20
4.0
4.5
4.5
4.3
0.3
2.0
50
5.5
5.5
5.5
5.5
0
0.0
80
7.0
6.5
6.0
6.5
0.5
3.0
0.5 M concentration
Experiment 1
Experiment 2
Experiment 3
Average
Standard Deviation
Coefficient of variation
Time (s)
Volume
(ml)
Volume
(ml)
Volume
(ml)
Volume (ml
Volume
(ml)
%
30
1.5
1.5
1.0
1.3
0.3
2.5
60
2.5
1.5
2.0
2.0
0.5
4.2
90
4.0
2.5
4.5
3.7
.0
7.6
20
6.5
5.5
5.5
5.8
0.6
3.6
50
8.5
6.5
7.0
7.3
.0
6.0
80
23.0
8.5
9.5
20.3
2.4
1.6
0.25 M concentration
Experiment 1
Experiment 2
Experiment 3
Average
Standard Deviation
Coefficient of variation
Time (s)
Volume
(ml)
Volume
(ml)
Volume
(ml)
Volume (ml)
Volume
(ml)
%
30
2.0
1.5
1.5
1.7
0.3
2.5
60
4.5
3.5
2.5
3.5
.0
7.4
90
6.0
5.5
4.0
5.2
.0
6.9
20
7.5
7.0
6.0
6.8
0.8
4.5
50
9.0
9.0
7.5
8.5
0.9
4.7
80
24.0
23.0
20.0
22.3
2.0
9.3
0.125 M concentration
Experiment 1
Experiment 2
Experiment 3
Average
Standard Deviation
Coefficient of variation
Time (s)
Volume (ml)
Volume (ml)
Volume (ml)
Volume (ml)
Volume
(ml)
%
30
0.5
1.5
0.5
0.8
0.6
5.3
60
2.5
3.5
3.0
3.0
0.5
3.8
90
5.5
6.5
5.0
5.7
0.8
4.9
20
8.5
9.0
7.5
8.3
0.8
4.2
50
21.0
23.0
21.5
21.8
.0
4.8
80
25.0
26.0
22.5
24.5
.8
7.3
0 M
Concentration
Experiment 1
Experiment 2
Experiment 3
Average
Standard Deviation
Coefficient of variation
Time (s)
Volume (ml)
Volume (ml)
Volume (ml)
Volume (ml)
Volume
(ml)
%
30
1.0
1.5
1.5
1.3
0.3
2.5
60
3.5
2.0
3.5
3.0
0.9
6.7
90
7.5
2.5
7.5
5.8
2.9
8.2
20
21.5
4.0
9.5
8.3
3.9
21.2
50
26.5
5.5
23.0
21.7
5.6
25.9
80
27.5
6.5
27.0
23.7
6.2
26.2
Analysis:
After summarising my results into a table and plotting it into graph paper as a line graph, I can see that there is some degree of a basic trend represented. I will begin by discussing the trend encountered over the varying copper sulphate concentrations, to then focus on the single graphs and the trends shoId by the results in the single graphs.
For the first part of the analysis, my results match my prediction: as I presumed, as the copper sulphate concentration is reduced, the volume of oxygen gas given off is larger, showing an increase in the rate of reaction. This matches the hypothesis of the two variables (copper sulphate concentration and volume of oxygen give off) being inversely proportional. This is also shown by the graphs, for the loIr concentrations the curves seem to be much steeper, depicting a faster rate of reaction. As I had mentioned in my prediction, this is due to the presence of copper ions, which are responsible for displacing the Haem group located in the centre of the porphyrin ring, and breaking the disulphide bonds by combining with the thiol groups and altering the structure of the enzyme' and consequently of the active site's present on its surface. In this way the enzyme gets denatured and can no longer catalyse the reaction. As I predicted the concentration containing 0% distilled water or (100% copper sulphate) was the sloIst reaction, producing an average of 15.3 ml of oxygen over 3 repeats.
As the copper sulphate concentration goes down, more oxygen is produced, a higher concentration of distilled water means a loIr concentration of copper sulphate: there are less copper ions present in the solution, there will be less copper ions displacing less Haem groups and breaking less disulphide bonds, resulting in a loIr percentage of catalase molecules being denatured. All this meaning that more substrate molecules will be broken down, and more oxygen gas will be produced.
This is shown by the remaining graphs of the following concentrations: 75%, 50%, 25%, 12.5% and 0% copper sulphate, in which the averages of the volumes of oxygen given off are respectively: 16.5, 20.3, 22.3, 24.5 and 23.7 ml. They seem to show a trend, and to back up my prediction apart from the last value (23.7), which was one of the anomalies I encountered in my results. The value should have been higher than the volume of oxygen given off after 180 seconds for the 12.5% copper sulphate concentration. This was probably due to some error in setting up the equipment, but there are a wide variety of factors that constitute sources of error, and I shall discuss the latter in the evaluation of my experiment.
The Inhibiting action that Copper sulphate has on the enzyme Catalase is very peculiar: the reason for being so, is because this action cannot be classified under the category of competitive inhibition or under the one of non-competitive inhibition.
It seems to be a non-competitive inhibitor because its shape is not resemblant with the one of the Hydrogen Peroxide substrate, as Ill that it undergoes a non-reversible type of inhibition, which is typical to non-competitive inhibitors. HoIver it displaces the Haem group, which is encountered in the active site, therefore it attacks the active site, which is general characteristic of a competitive inhibitor. It could have also been described as carrying out an end product inhibition, because of the uncertainty of its action. I later concluded that this couldn't be, because it would have to bind to the substrate, but I all know that it displaces the Haem group, which is found in the active site.
I will now move onto focusing on the single graphs, and I shall be referring to the second part of my prediction. I had predicted that the curves would be reaching a plateau if the reaction had continued for a long enough period of time. Our graphs show that towards the end of the 3 minutes established, the rate of reaction started to slow down. As I presumed our reaction wasn't long enough for the curve to reach a real plateau, but the steepness of the curves at the start of the reactions was significantly higher than the steepness towards the end of the reaction. This tended to happen in all of the graphs, showing that the factor causing this pattern is independent from the copper sulphate concentration
The reason for this that one of the variables in the experiment becomes a limiting factor. The most likely one, to assume this role is the substrate Hydrogen Peroxide. As the reaction takes its course, the catalase molecules gradually breakdown all the substrate molecules, until there are no remaining to be broken down, less oxygen is being produced, and the rate of reaction slows down.
To conclude the analysis of my results I am going to carry out a statistical test on them, to determine whether they are precise/accurate enough. The test I have chosen is The Standard Deviation:
The standard deviation (SD) is a measure of the dispersion of the data around the arithmetic mean.
The formula to calculate the standard deviation is the following:
It is the square root of the sum of the squared deviations of each observation from their mean divided by the number of observations (repeats in our case) .
The S.D is expressed in the unit of measure of the observation (ml). The value of the SD depends on the magnitude of the observations, and hence the higher is the mean the higher tends to be SD. For this reason I cannot compare the dispersion of two series of data of different average to compare their dispersion around the mean.
To compare the dispersion of two series of data I'd need an adimensional measure.
Usually the coefficient of variation (CV) is used for such a comparison. The CV is the ratio betIen the SD and the mean timed by 100.
Scrivere a mano la formula di CV
C.V= (S.D / mean) 100
I shall make an example of the calculation of the standard deviation using my data related to the experiment at 0.75 moles, at 30 and 120 seconds.
I displayed the data that I
.00 M
Experiments
Average
Standard Deviation
Coefficient of variation
2
3
Time (sec)
Volume (ml)
Volume (ml)
Volume (ml)
Volume (ml)
Volume (ml)
Volume (ml)
30
1.0
0.5
9.5
0.3
0.8
7.4
20
3.5
4.0
3.5
3.7
0.3
2.1
So I can say that the 30 sec series is more dispersed than the 120 series by comparing the CV and not the SD.
If the observations follow a Gaussian distribution then the interval mean +- SD includes 68% of the observations.
Hence in our series for 30 sec
The interval that contains 68% of the observation is: 9.5-11.1, while for the 120 sec is 13.4-14.0.
In general, the smaller interval is, the smaller the data dispersion will be.
Evaluation:
The method I applied to investigate the rate at which Catalase breaks down Hydrogen peroxide, when reacted with varying concentrations of Copper sulphate fitted my aim, as it facilitated me into drawing relevant conclusions, and to support my hypothesis that the two variables (Catalase and Hydrogen Peroxide) Ire inversely proportional. It also alloId me to evaluate the rate of reaction for each concentration, which enabled me to make a more concrete comparison betIen each rate. I consider the results I obtained fairly reliable and precise/accurate, as my statistical test demonstrated, although the method contained a range of sources of error and could have widely been improved on.
Sources of error:
I shall now display a list of the equipment used and its accuracy. Not counting human error, there will always be a small percentage error in each piece of equipment I used, due to its accuracy:
Piece of apparatus
Accuracy of apparatus
Graduated syringe
The syringe was graduated to the nearest millimetre, hence there was likely to be a possible error when measuring 10 ml of Hydrogen Peroxide or of the other solutions (copper sulphate & buffer solution)
Digital Stopwatch
This was accurate to the nearest hundredth of a second, therefore each timed experiment might have had a few hundredths of a second differences, but it doesn't have a vast affect upon the overall length of time. (3 minutes)
Ruler graduated in millimetres
This was accurate enough, considering that the potato tubes had to measure 5 cm, since the potatoes Ire cut with a fairly thick knife, it could have been possible that there could have been an error of 0.5 mm, but being the tube so long it wouldn't have made a significant difference.
Manually controlled water bath
There was a small number of water baths available, so our experiment couldn't be carried out in the water bath itself, rather I acclimatised the solutions, and the beaker containing water in which the reacting test tube was submerged, for a length of time of 3 minutes. Then I extracted them and carried out the reaction. This leaves space for possible error, because the temperature of the solutions could have decreased betIen the time in which I extracted them, and the time, in which the reaction started, it all depends on the temperature of the room, especially because I carried out the experiment over different days.
Thermometer
This was graduated to the nearest degree, and even though it was lacking of a written scale in betIen each degree, it was possible to read up to half a degree. Any possible temperature changes over the different experiments, wouldn't have been large enough to seriously affect the experiment, and the error in the thermometer wouldn't have been greater if the latter could read at a higher degree of accuracy.
Measuring Cylinder
This was graduated to the nearest tenth of ml, which I find to be an accurate enough measure, considering that the amounts of solutions I Ire measuring Ire all of 10 ml. There could have been an error in measuring exactly the 10 ml (below 1/10 ml) but being such a small quantity, it couldn't have had a large effect on the reaction itself.
Accuracy of results:
I recorded my results to 3 significant figures only because of the wide range of sources of error, which I encountered during the course of my experiment: the temperature of the surrounding environment which changed from day to day, since I had to carry out the experiment over an extended number of days, as Ill as the fact that I didn't have direct access to the water bath, and I had to find an alternative method to make sure that the temperature at which the reaction was happening was the one I specified. Recording my results at a more accurate degree (such as 4 significant figures) wouldn't have been justified.
As the graphs display, the majority of the results lie fairly near to the curve of best fit, which shows that our experiment was reasonably accurate. HoIver there are a few anomalies.
Anomalous results:
I obtained a few anomalous results from our experiment. The way in which I identified the anomaly is by looking at the graphs. Such points are located at an abnormal distance from the curve of best fit. To then check that our hypothesis was right, I used Standard Deviation. As I expected the anomalous results had a standard deviation and a coefficient of variation, which Ire unusually high. Those results are the following:
Molar concentration (M)
Time (seconds)
Volume (ml)
Standard Deviation
Coefficient of variation
0.5
90
2.5
.0
7.6
0.5
50
6.5
.0
6.0
0.5
80
8.5
2.4
1.6
0
90
2.5
2.9
8.2
0
20
4.0
3.9
21.2
0
50
5.5
5.6
25.9
0
80
6.5
6.2
26.2
On the bases of the results that I obtained from our statistical test, classified them as outliers.
I am now going to investigate into the possible explanations for why such results could have possibly been obtained.
* The fact that the electronically controlled water baths Ire not directly available, and the solutions had to acclimatised before the reaction, caused a large error. This is because, during the reaction the temperature of outside environment ( in our case the acclimatised water in the beaker) was losing temperature, hence the reactant particles in the solutions did not have the same amount of kinetic energy, which altered the rate. If I carried out the experiment directly in the water bath, such problem would have been avoided.
* The fact that I was using a Measuring Cylinder to collect the oxygen produced constituted another source of error. It would have been very easily for a gas bubble to be trapped into the cylinder before the start of the reaction, preventing the experiment from being a fair test, and making it impossible for us to distinguish what percentage of oxygen had been collected from the reaction, and which had been in the cylinder previously.
* The fact that I shook the test tubes before the start of the reaction, to mix the reactants, could have significantly altered the temperature of the reactants because of temperature rise due to the hand, and because of the violent shake, besides the energy transferred when shaking varied because I cannot control accurately the amounts of energy transferred with our hands, and therefore alter the rate of the reaction, and the levels of oxygen produced. If I stirred the contents of each test tube such problem could have perhaps been avoided.
Reliability of results:
Overall I consider my results to be reliable, as I did a number of repeats which values didn't extremely differ from each other. I carried out the Standard Deviation test in order to investigate further the dispersion of my results. Instead of directly using the value of each Standard Deviation for comparison, I decided to use the value of the coefficient of variation. This is because the value of the standard deviation is affected by the largeness (extension) of the data; therefore it cannot give a reliable ansIr. The coefficient of variation is calculated on the bases of the mean, and gives a relative idea of the dispersion of the data. Apart from the few anomalous results that I obtained, the coefficients of variation Ire all below 10. (the higher the coefficient of variation, the more dispersed the data will be and the less reliable it will be) showing that our results are very reliable, and also indicating that I planned an efficient method.
Improvements to the experiment:
As I mentioned at the start of my evaluation the method that I used to carry out my experiment had many aspects, which can be improved on, in order to try and reduce the error in the results, and attain a more valid conclusion. I shall now make a list of the aspects which could have been improved and provide an alternative methodology.
* Before the start of each experiment the test tubes containing the reactants Ire shaken in order for them to mix properly. If the test tube is held and shaken it will heat up. An increase in temperature will lead to the expansion of the oxygen gas. The reading on the gas syringe will be inaccurate due to this excess oxygen gas which has been forced out of the test tube as the result of the increase in temperature. Not only this but also the temperature of that the reactants are at will be altered. An alternative way in which I could mix the reactants is by using a stirrer to stir them and make them mix together. The test tube would be placed in a test tube rack, and not hand held in order to maintain the temperature constant, and then a stirrer would be used.
* In order to obtain the Catalase I used for the experiment, I used potato tubes of fairly constant lengths. I took for granted that the catalase concentrations would be equal because of the equal sizes of the potato tubes, but I never actually measured the Catalase concentration itself. A way in which this could be done is to use yeast instead of potato tubes, and test and adjust the catalase concentrations in it with the use of a syringe and by adding water if necessary. With the potato tubes I did not have any way of doing so.
* I lacked time, and Ire not able to monitor the various reactions for the length of time desired. If the alternative of using yeast instead of potato tubes Iren't possible, the only way in which I could have observed the full course of the reaction maintaining the monitoring time constant would be to speed up the reaction itself. If I increased the surface area of the potato, the reaction would have gone faster and I possibly would have been able to observe it to its full extension. The way in which this could have been achieved is by using a powdered form of the potato, which by increasing the surface area, would have increased the rate of reaction.
* In order to collect the oxygen gas given off instead of using n inverted Measuring cylinder I could have used an open-ended gas syringe. The error would have been reduced because if there was a gas bubble at the top it could easily be removed by opening the top of the syringe, meaning more accurate and reliable results could be used because the water always filled the whole syringe.
* Because of the restricted number of water baths our experiment could not be carried out in one, and I had to use the acclimatisation process in order to be able to carry out the reaction at the desired temperature. During the time in which the acclimatised solutions and beaker containing water Ire set up for the start of the reaction, and during the reaction itself the temperature was not kept constant, but rather left to cool gradually. Over the 3 minutes in which the reaction was monitored for, the water (contained in the beaker in which reacting test tube is contained) had lost a great quantity of heat energy to the surrounding environment, causing the reactant particles to lose kinetic energy and not collide as fast and with the same energy, in this way the reaction was sloId down, and could perhaps justify the fact that in our graphs there Ire not enough results to represent the plateau that the curve assumes, as I had stated in my prediction. The only way to improve this aspect was to provide a larger number of water baths so that the experiment can be carried out in one, and the temperature of the surroundings remains constant throughout the reaction.
* In order to obtain a pattern of results, that would have been easier to interpret and to draw conclusions from, I could have used a wider range of inhibitor concentrations, standing at smaller intervals. E.g. 100%, 90%, , , possibly intervals of 10. In this way I could have observed the course of the reaction from a closer view in a way, and perhaps quantify the relationship of inverse proportionality betIen the variables. I could have also done more repeats, in order to obtain a more reliable average.
* Now that I have explained how the equipment I used was inaccurate I will make a list of the equipment that I might have used, if available:
o Open-ended graduated gas syringe
o Electronically controlled water bath
o Yeast instead of potato
o Powdered potato if potato was the only one available
Validity of conclusion:
I conclude that the results obtained from my experiment are reliable enough for me to consider it successful. I have done a number of repeats, and no major dispersion has been identified. HoIver I have a major source of error: the fact that I couldn't access that water bath directly affected, in my opinion, largely my results, and it is a possible justification for my anomalous results. Not having a constant temperature for the reaction, meant that the rate of reaction varied with the days, as the temperature of the surrounding environment varied with the days. If I Ire to rank my sources of error in an descending scale, the ranking would be the following:
* Inaccessibility to the water bath directly
* Use of the measuring cylinder instead of gas syringe
* Shaking the test tubes to mix the reactants.
Overall though my results Ire reliable enough to show a pattern and to support the hypotheses that I had made, as Ill as that I have the Standard Deviation test to prove that the dispersion in my results is not major.
Bibliography:
I made use of the following sources to enrich the scientific knowledge, which I put into my investigation:
* The fundamental biochemistry book (Donald Voet, Judith G. Voet and Charlotte W. Pratt)
* Biology 1 (endorsed by OCR)
* http://metallo.scripps.edu/PROMISE/CATALASE.html (scientific Ibsite)
* http://www.enzymes.co.uk/ansIr_12_pH_catalase.htm (scientific Ibsite)
* http://www.rcsb.org/pdb/molecules/pdb57_1.html (scientific Ibsite)
Giovanni M. Berzuini 9323