(3) and (4)
Rate of Reaction
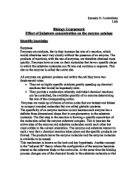
Substrate Concentration
The rate of reaction increases as the concentration of enzyme increases. If there is plenty of substrate the only limiting factor will be the enzyme concentration you increase the number of active sites available.
Rate of Reaction
Enzyme Concentration
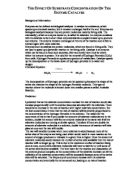
The rate of an enzyme catalased reaction will vary with temperature. At low temperatures the reaction will take place very slowly. This is because the substrate molecules are moving very slowly and having a smaller probability of colliding with the active site and forming an enzyme substrate complex. As the temperature rises the enzyme and substrate molecules move faster, collisions happen more frequently, so the substrate molecules enter the active site more often and collide with more energy. Above a certain temperature the structure of the enzyme molecule will vibrate so energetically that some of the bonds holding the enzyme in its shape break. The enzyme breaks down and is referred to as denatured. The rate of reaction will slow down and then no longer occur. The temperature at which the enzyme catalyses a reaction at a maximum rate is known as the optimum temperature.
Enzymes are affected by pH. Most enzymes work within a tiny pH range. If conditions vary from this range, become more acidic or alkali the enzyme will denature (break down).
(5)
This is the reaction that takes place when hydrogen peroxide is denatured; this is also the reaction, which shall be occurring in the experiment:
catalase
Hydrogen Peroxide Water + Oxygen
2H2O2 2H2O + O2
Plan
In this investigation the rate at which hydrogen peroxide is broken down by catalase will be the dependent variable. This will be measured by recording how much oxygen is produced every 10 seconds with different concentrations of hydrogen peroxide. The independent variable will be the concentration of the hydrogen peroxide.
Prediction
The higher the concentration of the hydrogen peroxide the more oxygen will be produced this will be tested. This is because more molecules of hydrogen peroxide are available at high concentrations to collide with catalase enzyme molecules, more molecules colliding with sufficient activation energy and more molecules can fit into the active sites of the enzyme molecules by the lock and key hypothesis referred to in the background on page 2.
Preliminary Investigation
1. Concentrations were made up of 20%, 40%, 60%, 80% and 100% of 10 vol. concentration hydrogen peroxide, (i.e. in the 20% concentration, it would have 20% hydrogen peroxide and 80% water). 10mls of each concentration were made. 10vol. hydrogen peroxide was used.
2. A 2% concentration of yeast was made up, with 98% water.
3. 5mls of hydrogen peroxide was pulled up into a syringe and put into the conical flask.
4. The delivery tube and bung were fitted onto the top of the conical flask to join it and the gas syringe.
5. 5mls of the yeast solution was drawn into another syringe with rubber piping on its opening to prevent loss of oxygen from air spaces. This yeast was squirted into the conical flask with the hydrogen peroxide through a delivery tube, the syringe left in the top of the delivery tube.
6. The stopwatch was started as the yeast was inserted.
7. Every 10s the amount of oxygen in the gas syringe was measured.
In the main experiment there will not be any changes made as this experiment went smoothly and the results were accurate; except there will be more replicates of each concentration.
Results Table to Show the Results Obtained in the Preliminary Investigation
Apparatus
Large beakers
Measuring Cylinders
Top-pan balance
Tap
Chemicals
2g yeast in 100ml water = 2%
100 ml each concentration, 10vol Hydrogen Peroxide
5mls of each used in each separate experiment
Clamp
Rubber Tubing Small Beakers Gas Syringe
Conical flask
with delivery Stand
tube
Conical Flask Stopwatch
Glass rod
Plastic syringes
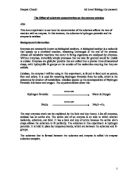
Method
- Start by making the yeast concentration of 2% by mixing the yeast with 100mls water.
- Make the hydrogen peroxide concentrations, 20%, 40%, 60%, 80% and 100%. Mix the said amount of 10 vol. hydrogen peroxide with x amount of water to make the concentration up to 100mls. To make 100mls of the 20% concentration of hydrogen peroxide 80mls of water would be needed as well as 20ml of hydrogen peroxide.
- After making these concentrations and putting them each in their separate beakers. The apparatus would then be set up as shown in the diagram above.
- Put 5mls of the first hydrogen peroxide concentration into the conical flask; put its bung with delivery tube onto it.
- Measure out 5mls of the yeast solution using a plastic syringe and squirt this into the flask through the delivery tube.
- At the same time start the stopwatch.
- Every 10 seconds for 2 minutes take a reading from the amount of oxygen produced in the gas syringe.
- Repeat this experiment with each concentration three times to insure that there are no inconsistent results.
Fair Test
To make this a fair test, it will be made sure that the same volume of hydrogen peroxide concentrations will be measured out for each concentration’s experiments and the same volume and concentration of yeast will be used for each. It will also be made sure that the oxygen produced will not be lost, as it will not have any leaks for this to occur. The volume of oxygen produced in the gas syringe was measured for the same amount of time in each individual experiment. The time intervals that the readings will be taken in will be kept the same and the amount of tests carried out for each concentration also. The variables are the different concentrations of hydrogen peroxide used and the same procedure will be carried out for the making of each concentration.
Safety
A lab coat and goggles will be worn in case of spillages of the corrosive Hydrogen Peroxide. If a spill occurs it will be mopped up immediately.
Results
Anomalous Points are marked in bold.
Table to Show the Volume of Oxygen Produced when a 100% Concentration of Hydrogen Peroxide is broken down
Table to Show the Volume of Oxygen Produced when an 80% Concentration of Hydrogen Peroxide is broken down
Table to Show the Volume of Oxygen Produced when a 60% Concentration of Hydrogen Peroxide is broken down
Table to Show the Volume of Oxygen Produced when a 40% Concentration of Hydrogen Peroxide is broken down
Table to Show the Volume of Oxygen Produced when a 20% Concentration of Hydrogen Peroxide is broken down
Table to Show the Averages of Oxygen Produced for each of the Different Concentrations of Hydrogen Peroxide so That it is Easier to Compare Them More Readily for the Analysis
Rate of Reaction = Volume of Oxygen Produced between 10 and 20 seconds
10 seconds
Table to Show the Rate of Reaction for Each Concentration
Analysis
The results above have been averaged and included in the results tables of their concentrations and also a results table of all the concentration’s of hydrogen peroxide’s averages has been done. A graph to show the concentration of hydrogen peroxide against volume of oxygen produced in given time intervals is on the previous page. The rate of reaction for each concentration has been done; a table and graph have been done to show this. The rate of reaction graph shows that the greater the concentrations of hydrogen peroxide the higher the rate of reaction. The line of best of fit shows a directly proportional relationship between the concentration of hydrogen peroxide and the rate of reaction, e.g. when the concentration is 20% hydrogen peroxide the rate of reaction is 0.1ml/s and when the concentration of hydrogen peroxide is 80% the rate of reaction is 0.4ml/s. If there is plenty of substrate the only limiting factor will be the enzyme concentration you increase the number of active sites available. In order to start a reaction energy is required to first break the bonds. This is called activation energy. Enzymes decrease the activation energy required for a reaction by providing an active site where reactions can occur more easily. Enzymes reduce the activation energy required for a reaction to occur. Enzymes are biological catalysts they have active sites where reactions occur. They have globular proteins. They have a specific shape formed from tertiary structure. They are affected by temperature and pH. They increase the rate of reaction. They are specific. They lower the activation energy. Enzyme active sites are specific to one type of molecule, amylase, which breaks down glycosidic bonds to form maltose and catalase breaks down hydrogen peroxide to form water and oxygen. Enzymes are proteins and are made up of a particular sequence of amino acids. A small number of the amino acids make up the enzymes active site. This is the part of the enzyme where a substrate will fit forming an enzyme substrate complex. The products are released from the active site leaving the enzyme free to combine with another substrate. The rate at which enzymes work can be affected by substrate concentration and enzyme concentration. If the substrate is increased the rate of an enzyme – controlled reaction will also increase until the enzyme concentration becomes limiting. The rate of reaction increases as the concentration of enzyme increases. If there is plenty of substrate the only limiting factor will be the enzyme concentration you increase the number of active sites available. I think that the higher the concentration of the hydrogen peroxide the more oxygen will be produced. This is because there are more molecules of hydrogen peroxide to collide with catalase enzyme molecules, more molecules colliding with sufficient activation energy and more molecules can fit into the active sites of the enzyme molecules by the lock and key hypotheses referred to in the background on page 2. This prediction is correct. In the graph to show the concentration of hydrogen peroxide against the volume of oxygen produced in given time intervals the lines of best fit level off towards the end of the two minutes this may be because all the active sites are used.
Evaluation
The method was accurate and efficient enough to prove the prediction, it did show that as the substrate concentration increases the rate of reaction and oxygen produced also increase. The anomalous results have been pointed out in the tables of results in bold. In the 100% concentration of hydrogen peroxide experiment at 100 seconds the amount of oxygen produced is 68ml this is too high in relation to the other results at this time, this may be due to an aggravation or disruption, which caused the reaction to speed up and for oxygen to be produced more quickly. The other anomalous results there are in a continuous string lower than the others this may be due to many different errors in the procedure that only occurred in that one experiment but it may have been that the wrong concentration of hydrogen peroxide was used in that experiment, or the yeast may not have been mixed properly, a leak in the apparatus may have occurred allowing oxygen to escape, and also as the yeast is a living organism it may have been colder in this experiment, in relation to the others, not allowing the reaction to take place as it may have otherwise. The distribution of results before averages were taken was very little except for the anomalous points a lot of the results were within 1ml of each other; this shows that the results are accurate. There were some major errors in the procedure for example when the yeast was injected some yeast remained in the delivery tube, but when some air was pulled up into the syringe and then pushed out again the yeast was moved from the delivery tube and fell into the hydrogen peroxide at the bottom of the conical flask. There may have been leaks from the joints in the apparatus that may have caused some oxygen loss, which may have meant that the experiment was not as accurate as may have possibly been hoped. When the yeast was injected some air was displaced in the gas syringe that meant that each experiment started with a reading of between 4 and 6mls of “oxygen” in the syringe this was taken from the final reading to take this into account. The yeast, which was used, is living and so therefore is a variable as it relies on warm temperatures to live but it can change which makes it a variable which was not taken into account when the yeast was decided upon to be used. The pH of the yeast must also be taken into account as if the conditions are varied the experiment could be unfair, as if the enzymes become too acidic or alkali they could denature. To improve the investigation it may be a good idea to do more repetitions of each concentration and to use a narrow concentration range of hydrogen peroxide, of maybe every 10% instead of 20%, so that you can really see the differences and analyse the effect of catalase on hydrogen peroxide a lot more easily and reliably, also it may be effective to warm the yeast before using it in the experiment so that it is used at its optimum. It would be useful if the gas syringe was more accurate so that there would be less deviation so that if error bars were drawn the distribution of results would be shown better, the oxygen could also be collected above water to reduce loss of oxygen.
Bibliography
- http://crystal.uah.edu/~carter/enzyme/catalase.htm
- http://members.aol.com/PeroxyMan/ and www.h2o2.com/ and Encarta 97 Encyclopaedia
- “Revise AS Biology” by Fosbury, Gregory and Sterons, Heinemann Publishers
- “Biology I” by Jones, Fasbery and Taylor, Cambridge Publishers
- “Biology for You” by William G, Stanley Thomas Publishers