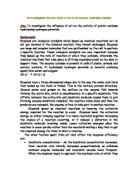
Lock and Key Theory
The lock and key theory uses the idea of the enzyme’s active site acting like a lock, and the substrate acting like a key. Like a key binds to a lock, the substrate binds to the active site of an enzyme, forming an enzyme-substrate complex. Like a lock is specific to one shape of key, an enzyme’s active site is specific to one shape of substrate [5]. The substrate enters the active site of the enzyme, in which bonds are either broken or formed. The products then diffuse away, and the enzyme continues to function.
Induced Fit
Another theory between the enzyme and substrate reaction is that of the ‘Induced Fit’. This theory says that the enzyme and its active site are partially flexible [5], and that as the substrate enters the active site of an enzyme, that active site changes shape slightly to completely bind the substrate within the active site. Figure 1.2 shows these processes in action.
In the case of my experiment, a Hydrogen Peroxide molecule will enter the active site of Catalase, in which it will be split into Oxygen and Water (in a catabolic reaction).
Hypothesis
My hypothesis is that the activity of Potato Catalase is affected by the concentration of Hydrogen Peroxide.
Predictions
The general relationship between substrate concentration and enzyme activity is that as there is fewer substrate present, the active site of many enzymes is empty and waiting for a substrate to bind with. This means that the reaction will be slower than what is chemically possible. Secondly, when there is a very large amount of substrate present, every active site will be occupied by a substrate molecule, with there being the fastest possible speed of the reaction. Adding more substrate will not increase this rate of reaction as there is no active site for the extra substrate to bind with, so this means that the reaction will be limited by substrate concentration. From this, I predict that as the concentration of Hydrogen Peroxide increases, the activity will initially increase, and the rate of increase slowly begin to level off until the rate of increase becomes zero. Figure 1.3 represents this idea.
Apparatus
The following is a list of apparatus that I will need to carry out my experiment. Included in the apparatus list is the use of the apparatus within the experiment and the justification as to why it was chosen.
Method
- Prepare Hydrogen Peroxide concentrations in ratios of 6 from 0:6 to 6:6
- Set up the apparatus as shown in figure 1.4
-
Add 5g of minced potato to the side-arm conical flask. Then add 10cm3 of buffer solution. Swirl gently to mix.
- Add the bung to the flask, making sure the bung is securely in place.
- Fill the measuring cylinder with water and invert into the beaker of water. Do not place the measuring cylinder over the end of the delivery tube.
-
Fill the syringe with 5cm3 of Hydrogen Peroxide and place into the bung hole.
- Inject the Hydrogen Peroxide into the conical flask. This will displace air which must not enter the measuring cylinder.
- Immediately place the measuring cylinder over the end of the delivery tube. Record the volume of Oxygen collected every 30 seconds for 5 minutes.
-
Repeat the experiment using a different buffer solution and fresh potato.
Control Variable
In this experiment, there are several factors which must be controlled to ensure accurate results. Ensuring a fair test is of great importance in my experiment and I must make every effort to ensure accuracy. If variables are not controlled, my results could potentially be inaccurate.
Variables
The pH affects the ionization states of amino acids These charges create the 3D shape of the enzyme, and if changed could cause the shape of the enzyme’s active site to change. This can cause the enzyme being unable to bind to substrate.
Enzymes have an optimum pH. However, with each enzyme this optimum which changes. Enzymes have an optimum pH due to the environment in which it is present. For example, the stomach has an acidic environment (about pH 2), so therefore enzymes used in the stomach are adapted to function most efficiently at pH 2. Enzymes can still function outside of their optimum pH, however there is a limit to the variation of this. Figure 1.5 represents this idea.
Increased temperature gives enzymes more kinetic energy. This increases the change of collisions between enzyme and substrate. Like pH, each enzyme has a specific temperature at which if functions most efficiently, and it also varies from enzyme to enzyme. Unlike pH, a graph of temperature-to-reaction-rate will not be symmetrical, but as an enzyme reaches a certain temperature, it will be denatured and cease to function, and thus the graph will decrease at a quicker rate of increase. Figure 1.6 shows this
An increased amount of enzymes will provide more active sites, thus increasing the rate of reaction. With a fixed amount of substrate present, once every substrate has joined in an enzyme-substrate complex, adding more enzymes will no longer increase the rate of reaction as there is no substrate for the enzyme to bind to. This is shown in Figure 1.7
This is the basis of my experiment and is discussed in my prediction section
Risk Assessment
In this experiment, I will be handling Hydrogen Peroxide, H2O2, which has several health hazards. These are.
- Heating may cause an explosion [6]
- Contact with combustible material may cause fire [6]
- Harmful by inhalation [3]
- Harmful if swallowed [3]
- Causes severe burns [3]
Safety precautions which I will need to apply to Hydrogen Peroxide to ensure a safe practical are.
- Keep away from combustible material [6]
- In case of contact with eyes or skin, rinse immediately with plenty of water and seek medical advice [6]
- Wear suitable gloves [6]
- Wear eye/face protection [6]
- In case of an accident, or if you feel unwell seek medical advice immediately[6]
Section 2 – Results
With my results, I will input the figures into Microsoft Excel. Here, I will use two formulas to collect information I will need. The first function I will use will be =AVERAGE(number 1, number 2…). This gets the average of a group of data and gives the figure to one decimal place.
The next function I will be using is =STDEV(number 1, number 2…). This gets the standard deviation of a group of data, which shows how closely the group of data is related to each other, and gives the figure to one decimal place. Here is a screenshot of my formula within excel.
Section 3.1 – Analysis
Section 3.2 – Analysis
Graph 2.8 shows that with a higher concentration of Hydrogen Peroxide, there is an increase in the Volume of Oxygen being produced, and therefore an increase in the rate of reaction. This is because as there is more substrate available, there are more Enzyme-Substrate Complexes being formed, each producing Oxygen. Therefore the more Enzyme-Substrate complexes being formed, the more Oxygen is being released.
With 0% concentration of Hydrogen Peroxide, there is simply nothing for Catalase to break down so obviously no Oxygen is produced. With increasing amounts of substrate, more and more Oxygen is being produced due to there being more availability to form Enzyme-Substrate Complexes.
Overall, my results provide evidence to support my hypothesis on how the concentration of Hydrogen Peroxide affects the rate of reaction between itself and Catalase. As I predicted, the volume of Oxygen produced would produce a graph with a decreasing gradient showing that as the amount of substrate present increased, the active sites of the enzymes became more and more occupied until the substrate had to wait for an enzyme to become available before it could bind.
Section 4 – EvaluationOverall, I am pleased with my results for this experiment. The majority of my results show the correct correlations and provide evidence to support my prediction.
There were not many individual errors in my experiment, however, graph 2.9b shows that the final volume of Oxygen recorded in a 2-to-6 concentration has dipped significantly below the line of best fit. I cannot be 100% sure as to the reason for this, however I would say that because only one set of results was affected, there was either something wrong with a particular batch of potato, or the percentage concentration of Hydrogen Peroxide which I measured and prepared was made in a slightly less percentage as to what it should have been.
For my experiment, I used 5g of Potato Catalase for each experiment. After collecting my results and drawing graphs it became apparent that even with 100% concentration of Hydrogen Peroxide, the fastest possible speed of the reaction was not happening. This means that the sample of Potato I had inside my side-arm conical flask was in great supply, and even with 100% concentration of Hydrogen Peroxide, every active site was still not occupied. Although the fastest possible speed of my reaction was never reached, my results still provide sound evidence as to how Potato Catalase is affected by Hydrogen Peroxide concentration. In doing this experiment again I would use less Potato Catalase per experiment. 2 – 3g would be enough.
To improve accuracy in my experiment, I repeated each experiment 3 times and used the averages in my graph. However, with the limited apparatus available for me to use at the time, there were many areas which have the potential to create inaccuracies within my results. These include:
-
A slight delay (about 1-2 seconds) between injecting the H2O2 into the side-arm conical flask, arranging the side-arm tube under the graduated tube and then initiating the stop clock.
- Electronic scales weighing to an accuracy of 0.01g
- The graduated tube measuring volumes to an accuracy of 1mm
- Measuring cylinder measuring chemicals to an accuracy of 1mm.
- The meniscus in both the graduated tube and measuring cylinder has the potential to create inaccuracies; however I tried to be consistent by measuring from the bottom of the meniscus for every recording.
In doing this experiment again, I would use another person to initiate the stop clock whilst I injected H2O2 into the side-arm conical flask and arranged the side-arm tube under the graduated tube. This would eliminate all potential errors in doing this action.
The scales I used have a possible uncertainty of 0.005g. This means that to find out the percentage error of a mass, I will use the formula (0.005/change in weight) x 100. In measuring 5g:
(0.005/5g) x100 = 0.1% inaccuracy.
When measuring the water, Hydrogen Peroxide and Buffer Solution I used a measuring cylinder which was able to take readings with a 0.1cm³ accuracy. This means that to find out the percentage error, I will use the formula (0.1/volume) x100. In measuring 10cm3:
(0.1/10cm3) x100 = 1% uncertainty
Although very small, these were several inaccuracies within my experiment which overall could affect the results which I collect.
My investigation could further be improved in many ways. If time and money were no obstacle, I would repeat my experiments more times get rid of any errors and provide a more sound set of results. I would also use more varied concentrations of Hydrogen Peroxide to increase the number or results that I have to compare.
I would also have used more accurate, electronic equipment to help me obtain readings as this was a main factor of inaccuracies.
For a further investigation I would like to experiment how different types of Catalases are affected by the concentration of Hydrogen Peroxide, for example, the effects of Hydrogen Peroxide on the activity of Liver Catalase. This would help me to further understand the nature of Catalase and would provide considerable additional evidence for me to create my conclusion.
References
- [1] “Molecules and Cells” - Nelson Advanced Science
P14 – 17, p33 – 36,
- [2] “Advanced Biology AS” – Biozone Learning Media
P75, P79 – 81
- [3] Evesham High School “Hazcards”
-
[4]
-
[5]
-
[6]