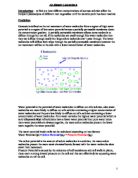
At 0.6M there will be a higher solute potential and lower water potential therefore the net movement of water molecules will be out of the root vegetable and into the hypertonic solution, therefore I predict the root vegetable will decrease in length and mass. A hypertonic solution should exist at 0.6M.
Furthermore at 0.7M I predict the greatest decrease in length and mass because more solute molecules are present and less water molecules which means the net movement of water molecules will be out the root vegetables and into the hypertonic solution this should show the greatest negative number because more solute molecules are present. The greatest hypertonic solution should exist at 0.7M, in this solution the root vegetable cylinder should become flaccid causing the protoplast to shrink until it’s not exerting any pressure on the cell wall because the net movement of water molecules will be out the protoplast and into the sucrose solution until zero pressure potential is reached.
Safety
- During the experiment standard lab safety procedures must be carried out. Make sure that all electrical equipment is away from any water.
- Don’t carry water across the room because if it spills, it could be hazardous and could cause an accident. For instance make sure no water comes into contact with the electronic balance because it’s an electrical appliance and if water comes into contact with the socket then it’s very dangerous, make sure your hands are dry when removing the socket or entering it.
- When using the scalpel be extremely careful as it’s very sharp and may cause harm if not used in a safe and appropriate way therefore be very careful when handling the scalpel.
- Be careful when using the glassware as its very dangerous if used carelessly, if it breaks into smaller pieces which are very sharp you must seek help right away also be careful when handling glassware as it’s very fragile and easily broken.
Fair test
During the experiment all variables must be kept the same in order to get fair and accurate results. However the only variable that will be changed is the concentration of the Sucrose solution as this is needed to vary to find the isotonic point in the root vegetables.
- When cutting the root vegetable cylinders ,they all need to be cut to the same size in length to keep the experiment fair and the same person must cut all the root vegetables because different people have different levels of accuracy according to there eye sight.
- Also when cutting the root vegetable cylinders they must not contain any dirt on either side as this will affect osmosis.
- Equipment must be clean before starting the experiment as chemicals left on the apparatus from previous experiments may affect the results which will be obtained.
- All the sucrose should be dissolved in the 1 litre of water during the dilution as the sucrose stock solution will not be exactly 1.0M therefore the concentrations which will be made will vary and this could affect the results.
- The same size core borer needs to be used as different core borers have a different diameter which means some root vegetable cylinders will have a greater surface area compared to others therefore the greater the surface area the faster osmosis will take place, which means the experiment will not be fair and accurate.
- The same electronic balance should be used to keep the same level of accuracy for weighing all the root vegetable cylinders.
- The same root vegetable should be used to take the cylinders from, as different root vegetables have various solute potentials therefore may cause variations within the results. Also they may have genetic differences because they are from different batches so some may have higher water potentials and others lower water potentials therefore the results obtained will not be precise or accurate because they will have different isotonic points.
- When adding the different sucrose solutions to the root vegetable cylinder the same amount of liquid needs to be added as this may change the solute potential or water potential.
- All the root vegetable cylinders will be left in the sucrose solution for the same amount of time over night to keep the experiment fair and accurate.
- Labels will be placed onto the McCartney bottles to distinguish between the different concentrations of sucrose solution added to the different root vegetables this will prevent confusion and contamination.
- Two different pipettes will be used to prevent contamination when serial dilution takes place which can affect the concentrations hence the reliability of the results.
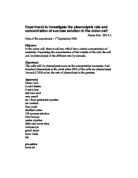
- Lids need to be placed on the McCartney bottles to prevent substances from entering the McCartney bottles and contamination from occurring also to prevent the solution from evaporating because this will affect the rate of osmosis as some of the solution is evaporating so there is less solution left therefore the isotonic point will be altered and the accuracy and precision of the experiment will be reduced.
Equipment List
- 1 Carrot, Potato, Parsnip, and Swede – required for the experiment to take place and used to find the isotonic point for each different vegetable by measuring the increase or decrease in mass and length to find the isotonic
- 20 McCartney bottles – used to hold the different concentrations of sucrose and different root vegetables, will be used instead of Petri dishes because they are more reliable as Petri dishes have lids that are loosely attached which reduces the reliability and precision of the experiment, furthermore I will use McCartney bottles because they have tighter lids which screw on therefore reduce the amount of evaporation and increases the reliability and precision of the experiment.
- Electronic balance – used to accurately weigh the mass of each root vegetable cylinder and has an accuracy to two d.p which makes the results obtained more accurate and precise. A two d.p electronic balance will measure smaller weight changes unlike a one d.p electronic balance therefore will increase the reliability of the results.
- 30mm Ruler – used to measure the length of the root vegetable cylinders so each one is the same size before there added to the sucrose solution, the same amount of surface area can be exposed to the sucrose solution.
- Scalpel – used to accurately cut the root vegetable cylinders to appropriate length and size, provides a more precise and reliable cut rather then a knife because it cuts either side of the vegetable cylinder to the same size which improves reliability and precision.
- Labels – used to place on each McCartney bottle to distinguish between different root vegetables to prevent confusion.
- Size 6 Core borer – used to cut and remove a cylinder shaped piece of each different root vegetable required for the experiment, I will use the same size core borer to make sure the experiment is fair as altering the size will alter the diameter of the vegetable cylinder causing the surface area to volume ratio to change therefore I will use the same size core borer for each root vegetable to increase the reliability and precision of my experiment.
- Funnel – prevents any spillages from taking place and provides an easy and convenient way to adding the water.
- Paper towels –used to clean up any spillages and lightly dry off the root vegetables once they have been in the sucrose solution, these will remove some of the excess solution on the vegetable cylinder which will improve the reliability of the mass obtained which will improve the accuracy of the mass measured.
- Tile – used to place the root vegetable on before cutting it to its appropriate size prevents work area from becoming damaged.
- Forceps – used to prevent the root vegetable coming into contact with anything including the skin.
-
Two 10cm3 Pipettes – used to accurately measure water and accurately measure the sucrose solution. I will use a different pipette for measuring the water and a different one to measure the sucrose solution to prevent contamination from taking place which will affect the reliability of my results. The 10cm3 pipettes have a percentage error of ±0.05 cm3 which is more accurate and reliable then using a syringe which has a higher percentage error therefore using a pipette will increase the accuracy and precision of the experiment.
- Two 200ml Beakers – contains the sucrose solution and water each one will be labeled to prevent confusion.
20cm3 of different sucrose solutions will be added to each McCartney bottle as this is the right amount to cover the root vegetable cylinder and doesn’t cause any spillages when the McCartney bottles are moved.
To make 20cm3 of the six different sucrose solutions for each different root vegetable I will need to add different amounts of water by serial dilution which is shown in the table below:
Method
- Collect all the required equipment and make sure it has been cleaned thoroughly using distilled water as it maybe contaminated from previous use.
- Label five McCartney bottles with parsnip and each one should be labelled with one of the five different concentrations 0.3M, 0.4M, 0.5M, 0.6M and 0.7M
- Using a different beaker measure 250ml of water, now you should have two beakers with 250ml of 1M sucrose solution in one beaker and 250ml of water in the other beaker.
- Collect the two pipettes and label one as sucrose and the other as water so there’s total accuracy and precision.
- Now using the two pipettes the sucrose pipette and the water pipette make the different sucrose solutions by the process dilution, the table above shows the exact amount of sucrose and water which needs to be added to make the different sucrose solutions ranging from 0.3M to 0.7M.
- All the required sucrose solutions have been made, now clean your hands and remove any unnecessary equipment away.
- Using a core borer cut out five identical parsnip cylinders from the same parsnip and remove the cylinders from the core borer, using a smaller core borer to push the cylinder out.
- Measure each of the five cylinders to exactly 30mm using an accurate ruler and remove any excess peel which may affect the rate of osmosis using a scalpel.
- In total there should be fifteen parsnip cylinders because each root vegetable will be repeated three times to get accurate and reliable results and hence five cylinders for each run will be required as there are five different concentrations being used.
- Next measure the mass of each parsnip cylinder using an electronic balance, record the ‘before’ mass of each parsnip cylinder in the results table and add one cylinder to each McCartney bottle.
- Repeat step 2 to step 11 for the carrot, potato and Swede.
- Finally leave all the root vegetable cylinders in the McCartney bottles over night, they all must be kept for the same time period.
- Dry off any excess water using a paper towel and measure the length using an accurate ruler also weigh all the cylinders and record the appropriate mass in the ‘after’ section in the results table.
Equations needed to calculate the percentage increase/ decrease in the mass and length of each root vegetable.
Mass = End mass- start mass ÷ start mass x 100
Length = End length- start length ÷ start length x 100
Results
Swede
Parsnip
Potato
Carrot
Analysis
Generally my results and graphs agree with my prediction because for all the vegetables used an increase in the molarity of sucrose solution would cause a decrease in the mass and length of the root vegetables, also a decrease in the molarity of sucrose solution theoretically will cause an increase in the mass and length of the different root vegetables. All my graphs show a continuous trend, they all show a negative correlation. The trend is as the molarity of the sucrose solution increases the percentage mass decreases and as the molarity decreases the percentage mass increases, to obtain the isotonic point for the different root vegetables I will use the line of best fit where the line crosses the x-axis from a positive percentage gain to a negative percentage gain.
Additionally the experiment was repeated three times and four different root vegetables were used to get accurate and precise results, for each root vegetable the mean was calculated by getting the average from the three experiments which then was plotted on a line graph to show the trends which occurred in the results.
Also all the line graphs and results tables for the different root vegetables support that part of my prediction is correct because they all show a gradual decrease in the percentage mass/length because there is a change from positive numbers to negative numbers as the molarity increases hence causing an increase in the solute potential. For example the carrot at 0.3M increased in mass from 1.26g to 1.29g when added to the sucrose solution and this caused a percentage difference of 2.33%, furthermore at 0.7M the mass decreased from 1.27g to 1.22g after being added to the sucrose solution and therefore showed a negative percentage change of -3.94%.
Overall by observing my graphs most of my results for the different root vegetable cylinders under 0.4M gained in mass and the root vegetable cylinders above 0.6M lost mass as expected in my prediction because due to osmosis the net movement of water molecules move down there concentration gradient from an area of high water potential (low solute potential) to an area of low water potential (high solute potential). This statement can be used to reinstate that each root vegetable placed in the 0.3M and 0.4M solution where water moved into the root vegetable cylinder where the amount of solute is high in order to create equilibrium which gives turgor pressure and makes the root vegetable cylinder turgid. The opposite would occur when a root vegetable cylinder was placed in a 0.6M and 0.7M solution where water moved out the root vegetable cylinder in order to create equilibrium with its surrounding environment in which the amount of solute is high.
I originally predicted that the isotonic point would occur at a molarity of 0.5M. This was the point at which the solute potential was equal to the water potential and therefore water moves in and out of the cell in equal rates. No change should be seen in the length or mass of the root vegetable, however this was untrue as none of the root vegetables line of best fit intersected with the x-axis around 0.5M solution.
This may have been caused by a number of errors and limitations which will be looked into more detail in the evaluation.
By looking at my graph for the Swede, I can locate the isotonic point because my line of best fit crosses the x axis, this occurs from positive percentage mass gain to negative percentage mass lost. The point at which the line of best fit intersects the x axis is at 0.44M. Therefore this is the isotonic point for the swede, theoretically the isotonic point which has been found for the length of the Swede cylinder should be the same as the isotonic point for the mass however taking into account other factors which will be discussed later on in the evaluation the isotonic point where the line of best fit intersects the x axis for the length of the Swede is 0.41M. This is not extremely off what I had predicted although I think I got a fairly accurate result for the Swede because it’s not that far away from the 0.5M which I had predicted.
Analysing the graph for the potato, I can find the isotonic point for the mass which is 0.40M sucrose solution, furthermore the isotonic point for the length is approximately 0.39M sucrose solution, the potato also follows the same trend as the Swede because at a lower concentration of solution there was a greater percentage mass gained plus as the concentration of solution increased the mass gained became negative and was lost.
By analysing the graph for the carrot I can locate the isotonic point for the mass which is 0.49M sucrose solution and like the other root vegetables it follows the same trend because the isotonic point for the length is slightly lower at 0.45M sucrose solution also at a lower concentration of solution, the greater the percentage mass gained at 0.3M sucrose solution. The carrot has the highest percentage increase out of all the root vegetables the percentage increase for the mass was 2.33% and for the length was 4.43% which shows that the carrot cylinder had increased the most in mass and length, this suggests that carrot had a lower water potential and was able to take in more solution due to osmosis, where water molecules move from an area of high water potential to an area of low water potential which reinstates what I used for my prediction.
The parsnip which was also used shows it has an isotonic point for the mass at 0.35M sucrose solution and unlike the other root vegetables has approximately the same isotonic point for the length, however the parsnip cylinder showed the smallest percentage increased gained at a lower concentration at 0.3M the percentage increase in mass was 1.49% and the percentage increase for the length was 2.18%. If you combine the length and the mass percentage together this suggests it was the root vegetable that had increased the smallest in mass and length compared to all the other root vegetables. This theoretically means that the parsnip had a high water potential and therefore released some of its water into the solution by the process osmosis.
The table below is a summary of all the isotonic points for both the mass and length of the different root vegetables used, the carrot has the highest isotonic point for both the length and mass which is then followed by the swede. Furthermore the potato has the third highest isotonic point which is then followed by the parsnip.
By looking at each analysis of the different root vegetables, I can say that my prediction was not completely correct however the carrot and Swede were the root vegetables that came the closest to my prediction which I had predicted using scientific knowledge about osmosis, pressure and water potential. However the isotonic point which I had predicted for the parsnip and potato were far off. Also I don’t feel that standard deviation or gradients would be necessary in interpreting the data I have obtained. Using the percentage mass/ length graphs that I used in the experiment, which were suitable to analyse and find the isotonic point for each different root vegetable.
Evaluation
Overall, I believe that my experiment went quite well, I achieved reasonably accurate results and can make a clear evaluation from them. All the results follow the same general pattern of a negative correlation. My choice of equipment, which was not brilliant, was suitable for this experiment.
Additionally I had never done any experiments like this therefore I was unsure on what results I would obtain, looking at my results and graphs now I could have narrowed down the concentrations which were used this would have improved the accuracy and reliability of my results.
I have also identified and circled the anonymous results on my graphs which deviate away quite significantly from the line of best fit and below is a table to show all the anonymous results obtained while carrying out the experiment.
In the above table there were two anonymous results for the swede, one occurring in both the percentage change in mass and the percentage change in length, in the table I have highlighted the actual percentage change and the expected percentage change. In this case the swede has an actual mass of 1.36% which in the 0.3M solution should be expected to be around 4.35%. Also the percentage change in length at 0.4M is -3.33% which should theoretically be around -0.55%.
The potato has got only one anonymous result which has occurred in the percentage change in mass, the actual percentage change in mass is 1.97% in the 0.3M solution and its expected to be 2.50%.
Furthermore the carrot has got two anonymous results, both in the percentage change in mass and the percentage change in length, the actual change in mass is -8.06% at 0.6M solution which is quite far away from the expected at -2.45%, the actual percentage change in length is -8.88% and theoretically it should be around -7.30%. Finally the parsnip which like the potato has only got one anonymous result in the percentage change in mass. The actual percentage change is -3.25% however the expected percentage change is -1.45%.
Overall these anonymous results could have been caused by various significant errors and limitations which will be discussed further on.
Significant limitations
One major limitation could have been caused by the accuracy of the equipment used, for example using the 10 cm3 pipettes which were used to make the sucrose dilutions required for the experiment, the pipettes have a percentage error of ±0.05 cm3 therefore when adding the sucrose or water 0.05 more or less could have added which will change the molarities of the sucrose solutions and therefore this could affect the percentage increase or decrease in length or mass this could have caused one or more of the anonymous results. To increase the precision of my results I will use more expensive, accurate reliable equipment which have a lower percentage error then pipettes.
Another major limitation occurred when you dried the root vegetable cylinder to remove the water off the vegetable cylinder which can lead to inaccuracies caused by different types of drying to each different vegetable cylinder, this can lead to inaccuracies in the mass recorded, I will use an alternative method which is more accurate and reliable then using a paper towel to improve the accuracy and precision of my experiment. Using a hairdryer provides the same amount of heat energy therefore next time I would use the hairdryer on each root vegetable but using a stop watch I would allow each root vegetable to have the same time limit being heated up to remove the excess water ;which changes the mass of the vegetable cylinder and causes inaccuracies which can lead to anonymous results.
The electronic balance which is used only goes to two decimal places therefore may cause the masses which are recorded to be inaccurate which could be a major limitation and affect the whole experiment, In addition I will use an electronic balance that goes to three decimal places rather then two to give me a more accurate and reliable recording of the mass of the root vegetable cylinder.
Also if the mass of the sucrose powder is inaccurately weighed because the balance only goes to two decimal places not three, then this is a major limitation and could affect the whole experiment, for example the electronic balance that goes to two decimal places may not precisely weigh the exact amount required to make the 1.0M stock solution therefore all the concentrations will be slightly altered causing variation in the results obtained.
A limitation could have occurred when putting the lids back onto the McCartney bottles because if some weren’t tightly screwed on properly some of the solution could have evaporated causing some root vegetable cylinders having more solution while others having less, this would cause inaccuracies and could have caused the experiment to change. In the future I will make sure I tightly screw on all the McCartney lids to prevent any of the solution to evaporate.
Also before using the equipment it should have all been thoroughly cleaned, however you cannot always guarantee this therefore the equipment could be contaminated by chemicals which have been used in previous experiments therefore this could have caused the sucrose solutions to be contaminated which theoretically changed the rate of osmosis depending on the type of chemical which has contaminated the solution. To minimise this problem I would wash every piece of equipment above 40 degrees so any bacteria and living organisms would be killed so they cannot interact with the sucrose solution and affect the accuracy and reliability of the experiment.
Also when using the 30mm ruler the lengths which are recorded don’t have the level of accuracy which are required in this experiment as they can lead to series inaccuracies and cause the outcome of the whole experiment to change, to prevent this from occurring you can use a micrometer which has a higher level of accuracy compare to a 30mm ruler. It will also increase the accuracy and precision of my experiment.
Additionally using a scalpel you might not be able to cut the root vegetable cylinders at a 90 degrees angle therefore the surface area to volume ratio will be different causing different root vegetables to have a faster or slower rate of osmosis depending on the surface area, larger the surface area the greater the gradient is and the faster the rate of osmosis will occur, however if theirs a small surface area then the gradient will be smaller so osmosis will be slower causing another inaccuracy which can affect the whole experiment. To prevent this from happening you could hold the scalpel against the metal ruler so you cut at a nice even 90 degrees angle.
Significant sources of error
Another problem could have been a persons vision because when measuring the length of the root vegetable cylinder they may have had weaker vision compared to other people therefore this might of accounted for one or more of my anonymous results, also if different people take the measurements for different root vegetables then this will result in more inaccuracies because different peoples vision differs therefore the results will become less accurate and precise, to prevent this from happening the same person must take the measurements for all the root vegetable cylinders as this could cause anonymous results.
Plus when measuring the root vegetable cylinders different rulers may have been used to measure the different root vegetable cylinders, this also caused by lack of concentration therefore some 30mm rulers may be more accurate then others and will result in accuracies and the experiment not being fair. To prevent this from happening use the same 30mm ruler for each root vegetable and make sure you are focused and concentration on what you are doing.
An additional human error which could have altered the results was when measuring the masses of the different root vegetable cylinders on the electronic balance, this could have been caused by a distraction and a inaccurate value may have been recorded, next time I will carry out my experiment where there is no distractions so there will be a lower chance of recording an inaccurate result. This could have been another factor which caused one or more of the anonymous results. Furthermore when placing the root vegetable cylinder on the electronic balance it might not have been set to 0.00g therefore this could change the overall mass of the cylinder which could lead to more inaccuracies, to avoid this problem I will make sure the electronic balance is set to 0.00g before I place the cylinder on it as this will give a more reliable and accurate mass.
Also if there was water on the balance and it didn’t get cleaned and you placed a root vegetable cylinder on there to record its mass, it would result in an error being made because the water on the electronic balance will add to the mass of the root vegetable cylinder and therefore result in inaccuracies, this will result in anonymous results.
The experiment which I did had some anonymous results which may have been caused by the errors such as lack of concentration, becoming distracted. I think my results are valid under the circumstances the experiment occurred, the limitations which occurred were mainly out of my control and if I was to repeat the experiment I would use more reliable equipment, a wider range of root vegetables and repeat the experiment more times to get good precise, reliable results.
Bibliography
Essential AS Biology for OCR- Glenn and Susan Toole
Biology 1- Cambridge Advanced Sciences-
Authors- Mary Jones, Richard Fosbery, Dennis Taylor
http://www.visionlearning.com/library/module_viewer.php?c3=1&mid=61&
AS level Biology – the revision guide Becky May, Kate Redmond
http://www.ias.ac.in/initiat/sci_ed/resources/chemistry/osmosis3.gif