The rate of immobilized enzymes compared to enzymes free in solution, at the same concentration, should be slower. If the enzymes (lactase) are encapsulated in beads of a substance, such as sodium alginate, then the substrate (milk) has to penetrate the beads in order to come in contact with the enzymes, if it cannot, then only the enzymes on the surface of the beads can catalyze it’s conversion into the product.
Preliminary Experiment
From the trial experiment, I hope to determine:
- The range of concentrations that I should use for my final experiment
- The variables, and how best to keep them constant
- The most appropriate way to measure the rate
- Mistakes that could be made which will help me to carry out a more accurate plan for my final experiment.
The variables that need to be kept constant are:
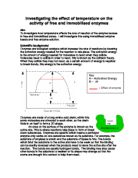
- Temperature: raising the temperature often increases the rate of a reaction, as molecules have more energy, and so move faster, therefore they are more likely to bump into each other and react. When they do collide, they are also more likely to be able to overcome the activation energy barrier and form a product However, because enzymes are proteins, they can be denatured by high temperature, as hydrogen bonds and hydrophobic interactions break in the molecule and it begins to lose its shape. It can no longer hold the substrate therefore cannot act as a catalyst. The optimum temperature is the temperature at which the rate of the reaction takes place fastest.
- pH: can affect an enzyme molecules structure also, as it affects the ionic bonds which hold the enzyme in place. Most enzymes only act over a narrow range of pH
- Substrate concentration: The more substrate, the more often they will bump into enzymes, the faster it will be converted into the product, therefore the faster the rate of the reaction. However, if the amount of enzyme is limited, each enzyme will be working as fast as it can, substrate ‘queues’ will form, and the rate will slow down.
Apparatus and Materials:
- Lactase (e.g. Novo Nordisk Lactozym)
- Sodium Alginate
- Calcium chloride solution
- Glucose strips (clinistix)
-
10cm3 plastic syringe x2
- Clamp stand
- Mini clamp for end of syringe
- Small beaker x6
- Glass rod
- Distilled water
- Pasteurized milk
- Plastic tea strainer
- Stop clock
Method:
To start with I need to look at the concentrations, and how to make them up. Mixing 8cm3 of sodium alginate made up in distilled water and 2cm3 of lactase in a beaker, I extracted 1cm3 of this mixture in a syringe, and added it to another beaker, mixing it with 9cm3 of distilled water, to produce and overall 10% solution of the original 100% solution. I repeat this same method twice again to get solutions of 1% and 0.1%.
Next, I extracted the 9cm3 of the100% solution into the 10cm3 syringe, and then carefully added this mixture into a beaker of calcium chloride. The beads formed immediately. I used a tea strainer, to remove them from the calcium chloride. I washed them in distilled water. I repeated this with the 10%, 1% and 0.1% solutions.
Now that all the beads have been prepared, next I need to set up the immobilized enzyme column, by fastening a syringe barrel to a clamp. At the end of the syringe barrel, a small piece of plastic tubing is attached, which a mini clamp is crewed tightly to, so that no milk or small beads, escape from the column. I placed a beaker directly beneath the syringe.
I put the first batch of 0.1% beads into the syringe barrel, filling it up until the 5cm3 marking. I added milk till the syringe was full, at the 10cm3 marking, and left it to stand for 15 seconds, before unscrewing the small clamp at the end of the syringe, so slow steady drops of milk were released. I started the stop clock, and placed a clinistick under the flow of milk droplets, to begin detecting for glucose. I then repeated this same method for the other beads I had prepared.
Next I needed to repeat the experiment using enzymes free in solution. Using the lactase, I placed 2cm3 again in a beaker and added 8 cm3 of distilled water, extracted 1 cm3 and put it into a different beaker mixing it with 9cm3 of water, to make a 10% concentration from the 100% concentrated solution, and repeated this method to obtain the 1% and 0.1% concentrations. I took the 0.1% concentrated solution and placed 5cm3 into the syringe barrel and added milk to the 10cm3 marking. I again left it for 15 seconds and unscrewed the clamp holding the end of the syringe, so a slow steady amount of milk began to flow, and used the glucose detecting strips once again, to time for when the strip changes colour.
Results:
Here are the results; a positive result is when the clinistix change from pink to purple, which indicates a complete change.
Analysis
The trend is clear in both sets of results: as the concentration of enzyme increased, the quicker the glucose detecting stick changed colour, therefore the faster the rate of the reaction. The lactase free in solution worked much quicker, at each concentration, compared to the immobilised lactase. Looking at each set of results separately, the trend for immobilised enzymes, the difference in time decreases extremely at each stage. The difference between the 0.1% and 1% concentrations is very large time interval of 645 seconds. Looking at the lactase free in solution, the same result is repeated, there is a another large jump of 210 seconds between the 0.1% and 1% concentrations, but a very small difference of five seconds between the 10% and 100% concentrations.
Conclusion:
The results match my hypothesis. The rate increased as the concentration of enzyme was increased. The enzymes free in solution, worked at a much faster rate in comparison to the immobilised enzymes.
Evaluation:
Overall, the experiment was successful, as I obtained results that matched with my hypothesis. However, there were some results that need to be questioned and explained:
- Why was there such a large difference in the 0.1% solutions in both the immobilised and free in solution lactase?
- Why was there was such a small difference between the 10% and 100% readings in the lactase free in solution?
The first question could simply be explained, that the 0.1% concentration, was just so weak that there was too many sodium alginate and water molecules, separating the milk from the lactase enzymes, making it take much longer, for any glucose to be detected, or that such small amounts of glucose was produced that it was hard to be exact about when the colour change was complete. That is one area that needs to be made more specific, when is it accurate to say that glucose has been detected? The clinistix, give different shades of purple to indicate the amount of glucose present, this can be difficult, to be precise about using qualitative results, so I think the best solution, is to say that glucose is detected when the clinistix has changed to the darkest purple possible, to get more accurate results for the rate of the reaction.
The second question could be because of several inaccuracies when carrying out the experiment. Perhaps there was a temperature increase, as the milk had been left out during the experiment when the 10% result was taken, making the rate faster, so that the 100% and 10% result had little difference between them. This could be improves in the final experiment by measuring the temperature and pH of the milk before the experiment begins, in both the immobilized and free in solution lactase enzymes. Another reason, that could have caused, this result, was that the syringe barrel was not cleaned out properly between results, which might have meant that different enzyme concentrations, may have been mixed.
Other areas, that I think would improve the experiment, is when making the beads leave them for a set amount of time to harden so that they do not clump together, and I should make sure that the mixtures of sodium alginate and lactase are mixed together well. The beads often came out at different sizes, especially when forming my first set of 100% concentrated beads, which might have meant that small beads were penetrated faster, which meant more enzyme substrate complex’s were formed quicker, increasing the rate. The number of beads, therefore also varied in the syringe barrel, within the 5cm3 mark. I think I need to make sure the beads out into the barrel, are all of similar size, this will also prevent beads getting stuck in syringe outlet restricting the flow of milk droplets.
I think that more than one set of results should be taken for each reading so that an average can be taken, for a fairer experiment, decreasing the chance of human error, and making sure that results, can be determined as anomalous fairly, such as the 0.1% results found above.
Final experiment:
Apparatus:
-
4cm3 Lactase (2cm3 for the immobilised enzymes and 2cm3 for the enzymes free in solution)
-
8cm3 Sodium Alginate solution, made up in distilled water
-
100cm3 of 2% calcium chloride solution
- Clinistix
-
10cm3 plastic syringe and syringe barrel (with measurement markings)
- Clamp stand
- Mini clamp and plastic tubing for outlet of syringe
- Small beaker x6
- Glass rod
- Distilled water
- Pasteurized milk
- Plastic tea strainer
- Stop clock
Method:
Mix 8cm3 of sodium alginate solution, thoroughly with 2cm3 of lactase in a beaker, using the glass rod. Carefully extract 1cm3 of this mixture, using the syringe, and add it to a new beaker, mixing it completely with 9cm3 of distilled water, which will produce a 10% concentrated solution, mark the beaker clearly. Mark the first beaker as 100% concentrated. Repeat the same method twice, by extracting another 1cm3 from the 10% marked beaker into a new beaker and mix it carefully with 9cm3 distilled water to produce a 1% concentrated solution. Finally take another 1cm3 from the 1% marked solution and add 9cm3 of water to make up a 0.1% concentrated solution, carefully mixing each mixture and clearly marking each beaker.
Next, carefully, extract 9cm3 of the 100% concentrated solution into the 10cm3 syringe, then cautiously watch how much pressure you apply to the syringe when creating droplets into the calcium chloride. The beads should form immediately, watch, however that strings of beads are not produced, and leave them to harden in the calcium chloride for a few minutes, before draining them with a tea strainer from the calcium chloride and washing them in distilled water. Check at this stage, that they are all roughly the same size and discard of any which are too small or too big. Repeat this process for the other mixtures that have been prepared.
Once all the beads have been prepared, the immobilized enzyme column needs to be prepared, clamp the syringe barrel, to the large clamp, and attach the plastic tubing and mini-clamp to the syringe outlet, check, by running some distilled water through the barrel that it is tightly fasted and now liquid can escape. Place a beaker directly beneath the outlet, ready to collect the lactose free milk. The milk should be checked at this stage for pH and temperature, using universal indicator paper and a thermometer.
Place the 100% concentrated beads into the barrel up until the 5cm3 marking, add milk till the syringe is full, and leave it to stand for 15 seconds, before unscrewing the mini-clamp, so that a steady slow flow of milk drops are released and start the stop clock. Place a clinistick in the flow of milk droplets and watch carefully to see when they change from pink to dark purple. Wash out the beads as well as the syringe barrel once the, glucose has been detected, and repeat the experiment once again using the 100% concentrated beads. Next take the 10% concentrated beads and carry out the same procedure, then for the 10% concentrated beads, then the 1% etc. There should be 8 results at this stage, two for each concentration of beads.
When carrying out the experiment for lactase free in solution, first take 2 cm3 of lactase and thoroughly mixed it with 8cm3 of distilled water, to produce an 100% concentrated solution, extract 1cm3 using a clean syringe and place it into a separate beaker adding 9cm3 of distilled water, to make a 10% solution, and continue the same method as used to make the mixtures for the immobilized enzymes, to get a 1% and 0.1% solution.
Using the same set up with the syringe barrel, place 5 cm3 of the 100% concentrated solution into the syringe barrel and add milk till the 10cm3 marking, stirring once with the glass rod. Leave to stand for 15 seconds, start the stop clock, undo the mini clamp at the syringe outlet allowing as similar as possible flow of milk as before, and place a clinistick underneath the flow of milk, to detect for glucose, till it changes from pink to dark purple. Repeat the experiment for each concentration, so that there are 8 results for enzymes free in solution, 2 for each different concentration.
Results:
pH: 7 (at beginning of both immobilized and lactase free in solution experiments)
Temperature: 24oC (at start of immobilized enzyme experiment) 22oC (at start of lactase free in solution)
Graph:
Analysis:
My results showed a steady trend, that as the concentration increased, for both lactase free in milk and immobilised lactase, the time for glucose to be detected decreased. When immobilised lactase was used it took much longer for glucose to be detected in comparison to the lactase free in solution, especially as the concentration increased.
This can be generally explained, as it takes longer for the lactase to penetrate the immobilised lactase beads, and filter through the immobilised enzyme column, as the concentration, increases. The lactase free in solution, are free to move and collide more frequently, with lactose, so more enzyme substrate complex’s can be formed, glucose forms faster, passing quickly through the column, this can explain why at the 100% concentration of lactase free in solution, it takes a very short time for glucose to be detected (average of 0.0083sec-1), almost half the amount of time compared to immobilised enzymes at 100% (average of 0.0031sec-1), as so many collisions take place, so glucose is produced at a much faster rate. At a 100% concentration of immobilised enzymes, it still takes time for it to pass through and pass the beads to the end of the column, to be detected at the end, the concentration, has increased, but the enzymes are still not free to move, so it is completely dependent on the movement and orientation of the lactose molecules in the milk. This explains the less dramatic increase in results, using immobilised enzymes, compared to enzymes free in solution. At 0.1% concentrations, both sets of results are fairly close together, which is surprising compared to my preliminary experiment. The fact that there were so few enzymes, within the beads, should have meant that very few enzyme substrate complexes should have formed, and the rate significantly reduced, but the rate is very similar as the rate for the enzymes free in solution, 0.0007 sec-1 average differences. This could possibly explained, that in the enzymes free in solution, the lactase enzymes became saturated very quickly, and long ‘queues’ of lactose molecules formed, slowing down the process. The large quantity of lactose molecules, prevented the small amount of glucose molecules produced, reaching the bottom of the syringe outlet, to be detected.
The pH was neutral, at 7, and the temperature, was roughly room temperature throughout the experiment, so neither of the se factors should have affected the results. The optimum temperature for lactase is 55oC, but as the enzyme is not particularly stable at this temperature for safety reasons, it was not heated. It was working generally much slower, than it could have been, but because this temperature was kept constant throughout the experiment, it should have not affected the comparisons, of concentrations. The optimum pH, for lactase is between 4.5 –7.5, so it was working within its optimum pH, which meant that the shape of the lactase enzymes, were just right for the lactose molecules, to form enzyme substrate complex’s successfully. However, the temperature, may have affected the pH, making it less desirable. The conditions were kept fairly constant throughout the experiment, so these factors should not have affected the results drastically. They might have caused the similar results in the 1% concentration results column, as if the temperature increased slightly, (2oC difference), the lactose molecules were given slightly more energy to collide and penetrate the lactase beads.
My results taken for immobilised, enzymes, seem fairly reliable, considering the small differences in the error bars, and steady increase in results, shown by the gradient’s. There is roughly 0.0003sec-1 differences in each of the readings, and between the concentrations about 0.0005sec-1 result variation. For the lactase, left free in milk, the error bars gradually increased, producing a very large error bar at the 100% concentration of (0.0029sec-1), displayed on the graph by the very steep gradient, which could be considered an anomalous result. This could possibly be because, even though, I was detecting the darkest purple as a positive result for glucose, because the glucose was produced and detected quickly, there was less of a gradual change of colour from pink to purple, making it harder to distinguish the exact end point, whilst monitoring the time.
Conclusion
Overall, my results have successfully proved my hypothesis, that as the concentration of the lactase increased, both in the immobilized lactase and lactase free in solution enzymes, the rate of the reaction increased also. My results also showed that, in comparison with each other, the rate of immobilized enzymes was slower than the enzymes free in solution. My original hypothesis was based on the theory, that as more enzymes are present, there are more likely to be collisions with the correct orientation, so that more enzyme substrate complex’s form, and lactose can be broken down into glucose and galactose. Even the anomalous results in the 100% enzyme concentration, which had an extreme decrease for the time taken to detect glucose, follows this rule, and could even be used to confirm the theory, proving that concentration affects the rate of the reaction considerably.
Evaluation:
I think that although the experiment was successful, several areas of the experiment could be improved, and explored further.
If the basic experiment method was kept the same, here are some improvements that could be made:
- Measuring the weight and size of the beads more accurately, to make sure they are all of a set size and weight
- Checking the pH and temperature, before the start of every result taken
- Carrying out several more repeats, to obtain a more accurate average
- I think the method of detecting glucose using the clinistix, to give a qualitative result, was the greatest limitation of the experiment. It made it more difficult to give an accurate time of conversion. This could be improved, by using more advanced type of glucose detecting sticks to measure the percentage of glucose conversion. This will give a quantitative, which would produce more accurate tables and graphs. I could use a set time for to check how much is converted. This would prevent problems such as interference of the beads and lactose and galactose molecules, blocking the glucose molecules from the end of the syringe outlet.
- Another difficulty, was in the rate of drops flowing from the syringe barrel, was hard to control, alternative apparatus, should be looked into, e.g. a burette
- I could look further into the structure and weights of the molecules produced and used, to see if e.g. weight of the molecules, effects how fast they reach the end of the syringe, perhaps, if glucose is lighter molecule than galactose, than it will not sink to the bottom of the syringe as quickly. This might mean that I should measure glucose conversion, by sticking the glucose stick into the beaker beneath the syringe outlet, after it has been stirred at a certain time, rather than the drops from the syringe outlet.
- I could do more detailed percentages especially exploring between 10% and 100% where the largest gradients were produced.
The experiment could be explored further, by changing a different variable, such as temperature or pH, to determine and prove these effects experimentally, to broaden my understanding of lactase enzymes further. I could explore what the activation energy, denaturing and optimum rate temperature/pH would be.
Health and safety had to be considered in this experiment, here are some of the guidelines I followed, as calcium chloride is irritating to the eyes, skin and respiratory system, we tried to make minimum skin contact and limit the possibility of inhalation, by careful and conscious handling of the products. Small amounts of lactase were left out for use, so there was none left over, so to avoid any drying up and causing dust formation, which could provoke asthma or hay fever, any spillages were cleared up quickly with water.
Bibliography:
Longman AS level Biology
Cambridge Advance Biology
Internet sites (found from Google)