Method:
Put on safety goggles and gloves, as hydrogen peroxide is a mild irritant.
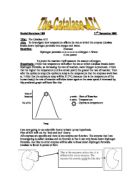
Core out a cylinder of potato, cut into discs using scalpel making sure all skin is removed from both ends and place in boiling tube.
Heat boiling tube in water bath at required temperature.
Measure out H2O2 and place in boiling tube, immediately place bung over boiling tube connected to gas syringe and start the stop clock.
Time how long it takes for gas syringe to reach the 10ml³ mark.
Repeat experiment with H2O2 at 10°C higher until 70°C.
Key factors:
pH- if the pH is too high or too low the enzyme can not work to its full potential as it is adapted to work at an optimum pH (the pH where it is found in the body/cell) as catalase is found in every living cell its optimum pH is neutral – 7. We could test this factor as it is easy to record using a buffer solution, but we wont be in this experiment.
Concentration of the hydrogen peroxide or enzyme – The higher the concentration the more particles there are to react with therefore the reaction is quicker. We could measure the concentration of H2O2 and add more potatoes to increase enzyme concentration but the scale of results would probably be too insignificant to record.
Volume of hydrogen peroxide or enzyme – Again like the concentration the larger the volume the more particles are present in the solution so the reaction occurs quicker.
Temperature – Due to collision theory, particles react quicker at higher temperatures until they reach extreme temperatures and disfigure. Temperature change is very easy to control and will provide a good range of results; therefore I will be investigating this factor.
Fair Test:
These make sure the results are precise and reliable.
- Repeat each experiment three times at every temperature.
- The same cork borer is used every time so the diameter of the potato discs is the same.
- The gas syringe is cleaned between every test so any residue is removed.
- Same potato is used as different potatoes may have different amounts of catalase
-
Same volume of H2O2 so there is the same amount of particles available to react.
- Same size disc, although the diameter will be the same, the width of each disc will have to be judged by eye as it is too difficult to measure 1-2ml with a ruler.
Before obtaining the final results we did some preliminary tests to ensure the key factors will be proportional and give a table of results. We used temperatures 30, 50 and 70°C and measured how long it took for 10ml of O2 to be produced.
pH - We are using the optimum 7, to speed up the rate of reaction
Concentration – There was only one concentration of H2O2 available
Volume - We decided to use 10 discs of potato but this wasn’t a sufficient amount of catalase to produce a considerable amount of O2 so in the final experiment we will use 20 discs. In this experiment we used 10ml³ of H2O2 but again the reaction was too slow so we will use 20ml³ in the final experiment.
Range of temperatures – we will be widening the range from 20 - 70°C with ten degree intervals. However if a particular temperature takes more than 15 minutes to reach the 10ml mark we will discard it and it will be anomalous. Once I have found an optimum temperature I will do two more tests 5°C either side to determine a more accurate optimum.
Prediction:
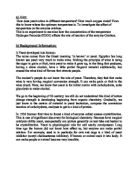
I predict that as the temperature rises it will take less and less time to produce 10ml of O2. This is because as the heat energy rises in the particles it enables each particle to move around quicker and collide with other particles more frequently with more force, this is called collision theory. I can now predict that the first part of my graph will look like this;
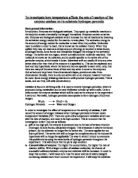
The fact that catalase is an enzyme and not a catalyst means it will denature after it exceeds body temp. Denaturing involves the active site becoming disfigured and incapable of ‘trapping’ the substrate due to the change in shape. So even though the particles are moving faster and colliding more often if the active site is denatured the enzyme will not work. Thus the rate of reaction decreases without the extra speed given by the enzyme. I can now predict that the graph will then take this shape;
This graph suggests a peak in rate, the temperature that this maximum peak occurs can be speculated as body temperature. This is because although we are using potatoes as a source of catalase, catalase can be found in every living cell thus in the body. Enzymes have evolved to perform at their best in their surrounding temperature. I predict that the maximum will occur around 37°C as this is body temp.
The rate at which the active site denatures is likely to occur quickly as the fit of the substrate into the enzymes active site is very tight and if a small amount of denaturing occurs the enzyme is no longer effective.
The catalyst magnesium (IV) oxide can also be used to speed up this particular reaction and unlike catalase it will not denature. This shows how sensitive enzymes are to temperature. Hence a rapid decrease in rate as soon as the enzyme starts to denature.
Obtaining:
Analysis:
To calculate rate of reaction I divided 1 by the average time, this produced a very small number that would be very hard to plot on a graph, and therefore I multiplied each answer by 10³.
The graph shows there is a significant increase between 20 and 35°C, from 1.35 to 4.88. This confirms my prediction that collision theory increases rate. By 40°C the rate has dropped to 4.61 and at 50°C the rate has dropped further this confirms my prediction that after a certain temperature the rate will drop due to denaturing of the enzyme.
The data also suggests an optimum temperature between 35 and 45°C however I am not sure of the exact optimum as I did not test every increment. I have drawn a dotted line either side of 35°C on my graphs to show this. Nevertheless I can estimate that the maximum rate will be around 37°C as this is body temp. This is in line with my prediction.
At 50°C the rate is 1.4, similar to that at 20°C, 1.35. By 60°C the rate has dropped further to 1.15, a much smaller margin than the previous temperature, this could be because by this time the enzyme is more or less fully denatured and so the rate cannot decrease much further anyway, but seeing as there was only one result recorded for 60°C there is a possibility that this result is anomalous as no average could be calculated.
From looking at the graph I can see that the curve preceding the optimum is a slightly steeper than the one following, this is a little surprising as I predicted that after the temperature had reached 37°C the rate would decrease more rapidly.
Evaluation:
From looking at the graphs I can see that not all the results were completely reliable or accurate but the general trend of the line was as expected.
On the graph showing time against temperature I have drawn an error bar on one of the temperatures investigated, this shows the lowest point and highest point that were recorded before adding them together with the other result to make an average, it shows how much error there could be in the results. As we can see the error bar is quite large so for the quality of these results I can expect to find the curves are not quite as accurate as I would have hoped.
To improve the experiment I need to make the error bar smaller, this can be done in numerous ways, from doing the full experiment once I am more prepared for things like the bung getting stuck, so by putting grease on it, it would fit better and prevent leaks. If I shake the test-tube whist in the water bath it would increase mixing of hydrogen peroxide and catalase. These small adjustments as well as more repeated results would hopefully reduce the risk of error.
The best-fit line of the graph supported my prediction well so I was able to draw up a good conclusion and could explain where perhaps the results were not entirely as expected.
To extend the experiment I could find the exact optimum by doing the test at every increment between 35 and 45°C. Or I could investigate catalase in another substance such as blood or liver or chose a new factor to investigate all together such as pH.