Therefore, as they are tilted, we can see the maximum they can tilt is as so:
This is only an estimate to what I believe will be true but we can see that the vessel with the lowest centre of gravity is able to tilt the most quite comfortably.
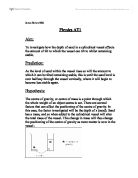
The other factors that could affect the maximum amount of tilt for a vessel are:
- The size of the base; a wide base means that the object has to tilt further before the centre of gravity passes over the pivot point. A small base means the centre of gravity quickly passes over the pivot point:
It is obvious the object on the right can tilt further whilst remaining stable.
- The height of the object; a tall object is going to have a higher centre of gravity, so therefore when tilted the centre of gravity will quickly pass over the pivot and become unstable. A shorter object will have a lower centre of gravity and thus will be able to tilt further.
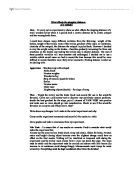
Diagram:
Method:
The vessel can hold 35cm2 tall, therefore the experiment is conducted at 8 intervals, these being in cm2 of sand, 0cm2; 5cm2; 10cm2; 15cm2; 20cm2; 25cm2; 30cm2; 35cm2. Each of these levels should be repeated to check for consistency in the results. The vessel when used must be on a flat surface, otherwise the centre of gravity may shift to one side giving inaccurate results. The depth of the sand should be measured out in a measuring cylinder before it is distributed into the vessel, and when it is distributed it must be level, i.e. perpendicular to the sides of the vessel. To measure the maximum tilt:
The right side of the vessel should be lined up with the 0 degree mark on the top of the protractor. Then slowly, the vessel should be pushed closely checking on the protractor the degrees through which it has successfully tilted past, and the last degree through which it passes before becoming unstable is the result for that depth of sand, which should be noted in a table, as shown below. This method should be carefully repeated for each depth of sand. Whilst conducting the experiment, make sure your hands are clean, as if they are sticky then the vessel may ‘stick’ to your finger thus giving a falsy result. After gaining a full set of results, a graph can be plotted of depth of sand on the x axis and on the y axis the maximum amount of tilt.
I believe my method to be fair for several reasons:
- Each depth of sand is made sure to be perpendicular to the sides of the vessel when flat on its base so the centre of gravity is undisturbed, i.e. not shifted to the left or right.
- Each depth of sand is conducted 3 times to check for consistency in the results.
- The maximum tilt is measured from the same point each time
Results:
Graph:
On separate sheet
Conclusion:
My results have proved my prediction correct, as the graph shows us that the maximum amount of tilt increases towards a point, which from the graph we find is 15cm2 of sand, and thereafter the maximum amount of tilt steadily decreases once more. As my results are as I predicted, I can conclude that in my opinion there are no erroneous results. The point of a depth of 15cm2 of sand allowed a tilt of 37 degrees, which was the maximum tilt that this vessel would allow. From this experiment, I can also conclude that as the amount of matter within the vessel varied, so did the amount of tilt, which proves that the centre of gravity was constantly shifting depending on the amount of matter within the vessel.
Evaluation:
I believe my experiment to have proved accurate, as it did follow as scientific theories state it should. My experimental method I believe to have been good at producing accurate results, although there are some changes I would like to make if I were to repeat the experiment:
- The type of ‘x’ used. Using sand means that as the vessel is tilted all the sand runs to one side as it is falling to the gravitational pull of the earth. An improvement in this aspect would be changing ‘x’ to a substance that would ‘stick’ to the vessel interior. By this I mean a substance that once in would not shift position and stay constantly perpendicular to the sides of the vessel. As the sand shifted position as the vessel was tilted this would mean the centre of gravit would shift as the mass is shifting, this could lead to inaccuracies, but as this problem was encountered across all tiers through which the experiment was conducted it means all results are inaccurate by the same amount which means that although they are technically wrong, as the problem was equal throughout the results are still reliable
- Measuring the amount of tilt in another method, as the employed method may have led to slight inaccuracies. When measuring the amount of tilt in degrees using a protractor stationed behind the vessel, it requires continuous concentration to find the exact degree at which the vessel finally drops. It also requires a great deal that your eye is examining the tilt from the same angle, is if it is viewed slightly to the left/right compared to your last one, then the amount of tilt shown on the protractor may look different. (For example, on an analogue clock, look at the time straight on, then at an angle to one side and then the other, each time the time will appear slightly different.) A method that could have been used could have been measuring the perpendicular height of the vessel top from the surface.
If I were able to re-conduct this experiment, I would also like to investigate further with depths of sand around 15cm2 to find out whether 15cm2 is the depth allowing the maximum tilt, or whether the maximum tilt is allowed by a close-by value to 15.