Aim –
to investigate the factors, which determine the stopping distance of rollers down a ramp
Apparatus-
- 3 rollers, all made from steel
- I ramp
- 2 meter rules
- a stretch of carpet
- a set square – to measure up to the half way point on the roller
Method -
- select a type of roller, and do not change it
- weigh a roller
- put the ramp at an angle, and keep it as a constant
- place the roller on to the ramp, and let go of it at a known distance.
- Record the distance from the bottom of the ramp to the half way point of the roller because the centre of gravity is in the middle. Do this five times and the find the average distance. (This was repeated five times, because there is no exact distance a roller will go from a certain height.)
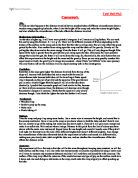
Theory-
When the roller is rolling down the slope then potential energy is converted to kinetic energy that converts into heat energy.
MGH = ½MVsquared
The loss of kinetic energy on the carpet is ….
½MVsquared = braking force x braking distance
therefore….
½Mvsquared = F x
so MGH = F x
If m, g and f are constant then….
However if G is constant then….
So….
This relation ship can be tested for a fixed angle, roller mass and fixed carpet.
Predictions-
In this experiment, before it was conducted and results were obtained , I predicted that for all the rollers, that the stopping distance would be directly proportional to the distance up the ramp. This prediction can be tested by plotting a graph of the results.
Variables and Constants in the Experiment
To maintain a fair test these are the procedures I had -
- 1 fixed angle
- 1 set of rollers
- to make sure that the ruler was at the bottom of the ramp
- A fixed interval (3,6,9ect….)
To find out if my predictions were correct, I conducted an experiment. It was set up as follows;
The Experiment
Aim –
to investigate the factors, which determine the stopping distance of rollers down a ramp
Apparatus-
- 3 rollers, all made from steel
- I ramp
- 2 meter rules
- a stretch of carpet
- a set square – to measure up to the half way point on the roller
Method -
- select a type of roller, and do not change it
- weigh a roller
- put the ramp at an angle, and keep it as a constant
- place the roller on to the ramp, and let go of it at a known distance.
- Record the distance from the bottom of the ramp to the half way point of the roller because the centre of gravity is in the middle. Do this five times and the find the average distance. (This was repeated five times, because there is no exact distance a roller will go from a certain height.)
Analysis -
Graph 1 (184g roller)-The results when plotted on a graph show a straight line. This means that there is a definite relationship between the distance up a ramp, and the stopping distance for a roller of a mass of 184g. If however the results showed a definite curve, then this would not be the case.
To find the relationship I rounded each of the averages to a whole numbers-
This shows that the stopping distance generally increased by 4, as the distance up the slope increased by 3. The three figures of 5 may be an error of calculation, or an error of an inefficiency of obtaining results.
However the last result, where it rose by 12, is because the roller started to curve when it came of the ramp and so gained extra distance.
-
Graph 2 (116.3g roller) – The results when plotted on a graph show a straight line. This means that there is a definite relationship between the distance up a ramp, and the stopping distance for a roller of a mass of 116.3g. Once again to find the relationship I rounded each of the averages to a whole numbers-
The results of this graph show that the majority of the time, the stopping distance would increase by 7, when the distance up the slope increased by 3.
-
Graph 3 (88g roller)- The results when plotted on a graph show a straight line. This means that there is a definite relationship between the distance up a ramp, and the stopping distance for a roller of a mass of 88g. Once again to find the relationship I rounded each of the averages to a whole numbers-
These results were very scattered, and so to find the relationship I thought that it would be best if I found an average of the increase in stopping distance. This came out to be 3.78 rounded up which equals 4. This means that the stopping distance generally increased by 4, as the distance up the slope increased by 3.
This proves that there is a relationship between the stopping distance and the distance up a ramp.
Here I plotted all the results from the previous rollers on to one graph. This was to en able me to find a relationship between the stopping distance, and the point at which a roller of a known mass was rolled from. I think that this helped me, as I could analyse each line of results together, instead of separately.
Conclusion
There is a relationship between the stopping distance of a roller, and the height from which it was rolled at. This also proves my prediction before I conducted the experiment.
It also means that there are very little outside or unknown factors affecting the stopping distance of the roller.
However I was not happy with the results for the last roller. This was because the results were to scattered. If I had the opportunity then I would get a second set of results for this roller.
I think that the 2nd roller went the furthest, because the first roller had more surface area in contact with the carpet, and so slowed it down.