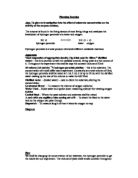
Distilled water - (boiled water) – used to dilute the substrate, altering the concentration
Graduated Biuret – To measure the volume of oxygen collected
Water Tank – Holds water and upside down measuring cylinder for viewing oxygen bubbles
Conical flask – Where the yeast solution and substrate shall be mixed
A cork with one capillary tube coming out of it – To attach the flask to the water tank so the oxygen can pass through
Stopwatch – To measure length of time it takes for oxygen to stop
Diagram
Plan
We shall be changing the concentration of our substrate, the hydrogen peroxide to get the results for our experiment. The volume of yeast shall remain constant throughout the experiment at 10ml. I decided on these measurements because they are simple to measure out and therefore should help make the experiment more accurate. Also, because they are just basic measurements to use, should I later wish to, I can greatly adapt on them to investigate the experiment further. For accurate results, measurements of the volume of oxygen made during the experiment, and the time it took to be made shall be carried out. The results shall be initially recorded in the table shown below:
To make the experiment a fair test, the following procedures should be conducted:
- The same person must measure the different measurements of substrate and yeast solution each time
- The measurements must also come from the originally provided hydrogen peroxide solution and yeast solution
- The same person must pour the substrate and yeast solution together into the conical flask each time
- The same person must time the experiment
- The same person must judge when the experiment is over
- The same person must judge the volume of oxygen
- The same person to put the cork back onto the conical flask
Prediction
I predict that the more hydrogen peroxide used in the concentration, the slower the reaction, but the more oxygen produced. The reason for my prediction is because with more hydrogen peroxide present, there is more for the enzyme to catalyse, and therefore an increased amount of time will be taken. However, with more substrate, there is more to break down, and therefore more oxygen to be obtained.
Method
Set up the apparatus as shown in the diagram above, filling both the water tank and graduated biuret with water. Measure out one of the concentrations from the table, and the 10 ml of yeast solution. Pour the yeast solution into the conical flask. Next also add the substrate, starting the watch and replacing the cork as quickly as possible. Time the experiment until the oxygen bubbles have stopped and the water level has stopped falling. If the graduated biuret is emptied, then stop the experiment. Record the results of both the oxygen made (use the graduated biuret to do this), and the time it took.
Repeat the experiment until all suggested concentration measurements have been investigated.
Reflection
As soon as the substrate and enzyme were mixed, bubbles of oxygen are released quickly. A large volume of oxygen will be collected when a more concentrated hydrogen peroxide solution is used. As the reaction continues, the rate of oxygen will slow down, until it eventually will stop completely. This could be measured by taken volume measurements every 30 seconds for example, a possibility for a further experiment.
The explanation for this is that when the enzyme and substrate are first mixed, there is a large number of substrate molecules. At any moment, virtually every enzyme molecule has a substrate molecule in its active site. The rate at which the reaction occurs will depend on the amount the enzyme has to catalyse, and on how many enzyme molecules there are, and the speed at which the enzyme can convert the substrate into product, release it, and then bind with another substrate molecule. As more and more substrate is converted into product, there are fewer and fewer substrate molecules to bind with enzymes. This means the reaction gets slower as the enzymes are left “waiting” for a substrate molecule to hit their active site. Once they are all converted, the reaction stops.
Other ways of extending the experiment could be to introduce heating of the catalase, possibly promoting faster reaction still, or trying even more varied concentrations.
Data obtained would be presented onto two graphs, (as drawn below). One graph would show concentration against time, and the other would show concentration against total volume of oxygen collected. By putting them into the graphs, it makes the results easy to analyse and draw accurate conclusions from.