-
Substrate Concentration – A larger concentration of H2O2 will contain more substrate molecules and therefore more collisions with the Catalase will take place per second, speeding up the reaction.
-
pH – Most enzymes work at an optimum pH of about 7, this is because they are protein molecules and so are damaged by strong acids or alkalis.
The factor I have chosen to investigate is the concentration of the substrate (H2O2).
Prediction
I predict that if I increase the concentration of Hydrogen Peroxide the reaction will go faster because there are more H2O2 molecules in the test tube so it is more likely that a collision will take place between the substrate and catalyst. The relationship between the concentration of H2O2 and the rate of reaction is said to be directly proportional so when the concentration doubles so does the rate of reaction, this is shown in the graph (2.a) below. However, although Catalase works incredibly fast (processing about 6 million H2O2 molecules per minute) it does take time to split up each molecule and so there is a limit to the maximum rate of reaction, once you reach the maximum concentration it doesn’t matter how many more molecules there are as the enzymes cannot work any faster this is shown in the second graph (2.b) below. To back up my prediction I carried out a pilot study using ,below are the results I gained using this program (2.c & d).
Sadie Tulley
Biology Coursework, Sept 2001
Page 3
The conditions for my pilot study are as follows: Volume of H2O2 = 25cm³, Mass of Catalyst = 0.20g, particle size of Catalyst = 0.75mm, Temperature = 25°C.
As you can see from the graph and table, a higher concentration of H2O2 resulted in a higher amount of gas being produced and therefore a quicker reaction taking place, this backs up my prediction that the relationship between the concentration of H2O2 and the speed of reaction (represented by the amount of gas produced in one minute) are directly proportional.
Method
Equipment: -
A Test tube A Test tube holder A Petri dish A Syringe 2 Beakers An Indelible Marker A Stop Watch
50cm³ of Calcium Chloride (CaCl2)
5cm³ of Sodium Alginate Jelly
5cm³ of Yeast Suspension
37cm³ of Hydrogen Peroxide (H2O2) in concentrations of 20%, 15%, 10%, 5% and 1% (to the make concentration of 1% I will need distilled water and 2% H2O2).
Diagram: -
Sadie Tulley
Biology Coursework, Sept 2001
Page 4
Safety
To keep the experiment safe I will wear safety goggles at all times, I will wash my hands after using chemicals and I will carefully follow all the Lab rules.
Fair Testing
It is important when doing my experiment that I do not change any of the other affecting factors that are listed above. To make sure I use the same volume of H2O2 for each experiment I will mark where the hydrogen peroxide comes up to on the test tube from the first test so I can re-fill the test tube with different concentrations but still keep the volume the same. All the chemicals I will use will be kept at room temperature before and during the test, this means that they will all be the same temperature (approx. 21°C). To keep the concentration of Catalase the same throughout the test I will sort through all the yeast beads I make so that the ones I use are all the same size and shape, I will also discard immediately any “floaters” as these beads already contain air and so are useless.
Instructions
- Wearing safety goggles take 5cm³ of Sodium Alginate Jelly and 5cm³ of Yeast Suspension and mix together in a small beaker.
- Fill up another small beaker with 50cm³ of Calcium Chloride.
-
Use the syringe to suck up the jelly and yeast mixture, slowly drop it into the CaCl2 drop by drop, as the mixture goes in it will form small beads, make about 30 beads.
- The beads should sink immediately to the bottom of the beaker, any that do not should be removed also any that have “tails” or are not round should be removed to keep the test fair.
-
Drain all of the CaCl2 away from the beads.
- Tip the beads out onto a Petri dish and sort them out into 5 piles of 5 beads, make sure all the beads are of similar size and shape and that none are deformed.
-
Fill one test tube with 20% concentration of H2O2; put it into the test tube holder and carefully mark where the liquid comes up to on the test tube with the indelible marker.
Sadie Tulley
Biology Coursework, Sept 2001
Page 5
- Set the stop clock to 00.00 and drop one bead into the test tube start timing immediately, watch the bead sink and as soon as it starts to rise again stop timing.
- Take the bead out of the test tube as soon as it has risen to the top.
- Record the result to the nearest half a second and repeat the experiment so you have 5 results.
- Wash out the test tube.
-
Repeat the whole experiment using 15%, 10%, 5% and 1% concentrations of H2O2. In the lab we do not have 15% and 1% concentrations of H2O2 so I will have to mix them myself, to do this I will use half and half of the concentrations that have an average of the concentration I wish to make, for example to make 15% I will use 20% and 10%, for 1% I will use 2% and distilled water.
I will record my results in the table below: -
I will repeat the experiment and work out the average to make the results more statistically valid. I will do this by adding up all the results for each concentration and dividing the results by 5.
I will work out the Rate of reaction so I can compare the rate to the concentration easier, I will work this out using the sum 100÷ av. speed(s).
Sadie Tulley
Biology Coursework, Sept 2001
Page 6
Results
Here are the results I collected in table form: -
I have drawn a graph for each of the concentrations of Hydrogen Peroxide to help me spot any anomalous results, I have also drawn a graph of all the concentrations and the rate to show the overall results, both are shown on the next page.
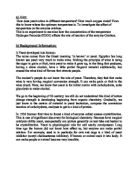
Conclusion
From my results I can see that, as I said in my prediction, the higher the concentration of Hydrogen Peroxide the quicker it is broken down into Water and Oxygen in the presence of the enzyme Catalase. The 20% concentration of H2O2 reacted about 17.5 times quicker than the 1% concentration; this is because a higher concentration contains more substrate molecules and therefore more collisions can occur between the enzyme and the substrate and a higher amount of collisions will result in a quicker rate of reaction. The graph I have drawn is shown on the next page, the line of best fit is a straight line which does not run through two points, these are two anomalous results, the results I gained from the line of best fit were nearly directly proportional as you can see from the table below:
Evaluation
I have succeeded in what I planned to do, which was to find out what affects the action of Catalase enzyme on the decomposition of Hydrogen Peroxide. When doing my experiment I gained two anomalous results, these were for the 5% and the 15% concentration hydrogen Peroxide, the uncharacteristic results could have been caused by a wrong reading of the stop clock or an odd sized yeast bead. I was disappointed that the graph did not show the rate of reaction levelling off, which is something I
Sadie Tulley
Biology Coursework, Sept 2001
Page 7
predicted would happen, if I was to re-do the experiment I would test a higher concentration of Hydrogen Peroxide to back up this part of my prediction. If I were to repeat the experiment I would probably drop more yeast beads into each concentration of H2O2 so my average would be more statistically valid. The results I have gained may be slightly erroneous because my reaction speed is not very fast, this means that I could have stopped the stop clock too soon or too late making my results inaccurate, to make up for this I rounded the results up to the nearest half a second. Temperature probably did not affect my experiment because all of the ingredients were kept in the same place at room temperature and all the tests were done on the same day within an hour. I could measure the rate of reaction in a completely different way to gain more accurate results; the method I would use to do this would be to use a conical flask to do the experiment in and then catch the oxygen gas produced in a gas syringe, using this method it is easier to read the results accurately, leaving less room for any imprecision.