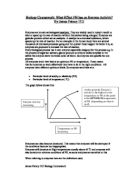
Regarding my graph I predict that the graph will be of a shape that I have shown in the beginning. I predict this because the enzyme, catalase will work as shown in the graph.
METHOD
For this investigation I shall be measuring the rate of reaction by measuring the amount of froth that appears when Hydrogen Peroxide reacts with liver with a certain pH being used each time. The pH range I will be using will be from 2.2 to 9.
The Enzyme, Catalase is present in the blood and hydrogen peroxide has the formula of 2H2O2, which consists of water and oxygen when it is broken down by catalase.
Here is a list of the apparatus I will require to carry out this investigation.
- Safety goggles
- Measuring cylinders x2
- Hydrogen Peroxide (20.0ml will be required each time)
- Universal indicator
- Liver (1.0gram to be used each time)
- Stop watch
- Hydrochloric acid
- Alkali
- Bucket
- Measuring scales (measure amount of liver)
- Ruler (cm) (in case froth over flows)
PLAN
Here is now how I plan to do this investigation.
- Initially I will pour 20.0ml of hydrogen peroxide into the measuring cylinder which I will move down so that precise millilitres of substance is added each time.
- Then I will add 2/3 drops of universal indicator to the hydrogen peroxide and write down the colour of the solution because this will ensure me that I am using the write pH at each time.
- I will then add 1.0 gram of liver and instantly press the button on the stopwatch. I will now measure the rate of reaction by measuring the amount of froth; I get in a standard amount of seconds.
The results will be placed in a table as shown:
- This procedure will be repeated with fresh liver will be used each time. With the adding of dilute acid or alkali and noting the colour I get.
- At the end of each experiment I shall pour the peroxide and liver into the bucket where it will be put be safely deposited.
Fair Test
As I am doing this experiment I will have to keep it a fair test. This means that the variables will have to be kept the same each time otherwise inappropriate results may occur and other readings being taken would be at an unfair disadvantage. So to make this experiment a fair test I shall keep the same amount of:
- Hydrogen peroxide (20.0ml)
- Liver (1.0g)
- Time (60 seconds)
- Universal indicator (2/3 drops)
I shall only change the pH each time because the whole of the investigation is to find out what effect pH has on enzyme activity.
In carrying out these procedures I believe that my test will be fair and anomalies will be kept to a minimum.
Accuracy
In doing this investigation I intend to make my results as accurate as possible. To achieve this I shall make sure that the cylinders are washed each time and there are no substances left in the cylinder. I shall also make sure correct amounts of peroxide is used every time and that the liver is the correct mass my using measuring scales.
To make my results as a whole more accurate I shall do the experiments three times so then I know that if my results are similar then the evidence is more reliable because in the first experiment an error may have occurred. I will plot a mean value for the results I get.
Safety
When I am doing this experiment I must consider the safety issues that may arise to my attention. I have considered how I shall under go this experiment and therefore summed up the safety measures that should be in placed to prevent any injury or damage. These are:
- Safety goggles must be worn to prevent splashes of any substances in the eyes
- The environment should be made clear with surfaces clear, bags and coats and stools placed in relevant places
- We should also be careful with the substances that will be used. Hydrogen peroxide is a corrosive substance so eye protection must be worn and concentrations of the substance must be kept low so there is not a harmful, extreme reaction. If substance is swallowed then the casualty’s mouth should be washed out and he or she should be given a glass or two of water and if the liquid gets in eyes or skin the area affected should be flooded with water. Where the problems occur medical attention must be on hand.
- Apparatus used such as measuring cylinders and beakers should be checked for any cracks as they could cause substances to spill.
Results
Here now are the results I collected whilst doing my experiment
Graph of results is shown next page.
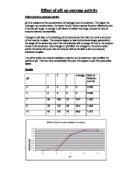
Analysis of results
The results I have collected tell me that without a doubt the pH of the solution does affect the rate of enzyme activity. My results show me that the enzyme works at a particular ‘optimum pH’.
My results display that at pH 4 the enzyme works at it’s greatest this must be obviously be the optimum pH in which the enzyme is kept or within a small range of 4 such as 3 or 5 also the enzyme denatured and will at pH 13 and above.
From my results I can explain them with a view in mind of the theory of science.
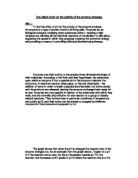
I can say that the enzyme works within a certain optimum pH and that the pH affects the activity of the enzyme, which is why at different PH’s the enzyme did not work best and denatured. On my graph where there is a certain peak, this peak shows the optimum pH, which is 5. This can be related to science because enzymes are suited to a certain pH.
Regarding my prediction I believe that I predicted correctly. I predicted that the enzyme would have worked best at a certain pH and the opposing levels the enzyme would react insufficiently. I can back this up or relate it to my prediction by saying that the enzyme work best at a pH of 5 and that the opposing pH levels of say 3 and 11 the enzyme reacted insufficiently.
From what I predicted about the graph I also believe this to be correct. I predicted that the graph would be of a shape as shown below:
Looking at my graph I am adamant that my graph follows this outline, the lines leading up to the optimum pH level and the peak.
Evaluation
The method I carried out in this experiment I believe gave me sufficient evidence for myself. The evidence I collected, I admit that it would be more reliable if I repeated it again just to make sure the anomalies are based upon the theory of science and not an error occurring due to any wrong doings done by myself in the experiment although I was pleased about the achievements I made in this experiment. If I re-do the experiment considering the errors that may have occurred I believe that my evidence would be correct and could always be relied on.
Looking at my graph I realised that there were three anomalous results as pointed out on my graph. These three results are at pH’s 4, 6 and 8. The cause of these results could be many for reasons. The rates per minute at these pH’s did not seem to fit in with the pattern of the rate speeding up towards an optimum pH then decline and becoming denatured. The cause of these anomalies could be that:
A major error occurred whilst calculating the mean values of results, which would then mean the whole results being different.
Incorrect pH of a solution may have been in the wrong beaker resulting in inaccurate results.
Relating to science the cause of the anomalies could be, that at those stated pH’s the solutions are to acidity or alkalinity causing the enzyme to break down and become denatured because with temperature enzymes can be denatured above 45 degrees I think that the same can happen with the pH of a solution because the two factors both effect the rate of enzyme activity.
Regarding the quantity of my results I think that what I have obtained is not enough and more precise pHs could have been used such as 5.5,5.6,5.7 then this would ensure me that evidence would be more reliable and prove the optimum pH. Also if further pH’s were used after 9 these could be plotted on the graph to summon up the evidence to draw a firm, sound conclusion on what I have proved.
Concerning my method there are a number of alterations or improvements I could have made to obtain more evidence to support my conclusion. As said I could have used further and more precise pHs of solutions.
A problem that was encountered whilst doing the experiment was that when the froth would rise it would be a bit difficult to measure how much it had risen because if it overflowed from the measuring cylinder, measuring it was quite a hard procedure and not accurate. To ensure this would not happen I could have used bigger measuring cylinders and in case froth would spill I would cello tape a ruler around the cylinder.
Also another problem that occurred was that noting the colour I get from the pH to diminish this problem I could have had sources of information which relate to the pH’s and it’s colours. Although my scientific knowledge enables me to recall the pH’s to their corresponding colours textbook material would have been handy to check that the pH of each solution was correct.
The experiment on the whole was a success, but it could be improved by the use of more accurate equipment and with me thinking more logically about minor implications that could occur.
Resources Used For Research
- CGP EDEXCEL Modular Science Revision Guide Book 1 Edited by Richard Parsons
- LONGMAN revision guides GCSE/key stage 4 Biology by Martin Barker, Alan Jones and Chris Millican
James Patney 11U Biology Coursework