I also predict that as the distance travelled increases, when I repeat the experiment there will be a variety of results collected.
So, I predict that the further back I pull the Newton meter, increasing the force, the further the margarine tub will travel.
Equipment:
Method: To set up the experiment we will tie the elastic band around the legs of the chair, making a sling-shot type mechanism. We will then attach the Newton meter to the elastic band. When the meter is pulled back to a certain force (measured in Newton’s) and release it, the band should exert the same force but in the opposite direction. When the tub is placed in front of the band, it will be propelled forward. The amount of force used has been determined by our preliminary experiment. We have decided that going up in groups of 1N (One Newton) is the best option. Our margarine tub will be empty.
See overleaf for preliminary test results.
Preliminary Results:
As you can see, 10N gives an output of over three meters which is too great to repeatedly measure. Also the data is more varied, with a range of 61Cm, compared to 2.2Cm in 5N. If my proper results are this varied, it would be hard to make a clear conclusion. But if they are varied I will compare them with other groups to check that they are accurate.
I will do each experiment five times. After this I will take the mean average, from this I can draw a graph so that I can see my results more clearly. The reason for repeating the experiment is so that the results are accurate and reliable. If I only did the experiment once, it could be wrong and I would not know. But repeating it means that you can see if your headed on the right track, because your results will be relatively close. It counts out any anomalies.
Results:
I have highlight results which are in consistent.
Even though these specified results seem to be out of place, when looking at the mean average you can see that overall my results are correct. Meaning I do not need to compare with another group.
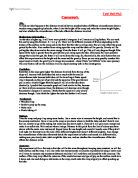
The graph also shows that as the amount of force being applied (N) is increasing; the resultant force is also increasing.
Conclusion: My prediction was correct as the curve on the graph goes up and my data proves the fact again. The values shown on my graph are the averages, I chose to show the mean average as it was easier to show. But it is also much clearer when looking at and interpreting the data.