To make it a fair test I used the same ball on the same surface and whether it was dropped from the top of the ball or the bottom of the ball. It is very easy to make mistakes on such an experiment, it is all done by eye and reaction times so it is not the most precise of methods. To make my data more precise and reliable I carried out the test 4 times and erased any anomalies in my data. Then I averaged the data to get a reasonably accurate graph which showed a visible relationship.
I am measuring the mass and the height so I can investigate why there is a loss of energy in the ball as it bounces back.
Page 1
Page 2
Page 3
My graphs showed that there is a definate relationship in the amount of energy lost when the ball is bounced from different heights. The graph also showed that when the ball bounced back up it somewhere lost 42% of its energy only having 58% left.
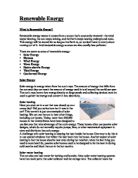
Here is a diagram of what happens to the ball.
G.P.E Gains kenetic
Loses energy (K.E) as it falls
m * g * h G.P.E
(kg) (10) (m)
New G.P.E
This diagram shows what happened to the ball and also shows how the ball loses its average 42% of energy. The energy is lost when when the ball bounces on the surface.
Page 4
When the ball is travelling through the air there is friction against the ball. friction causes heat (a source of energy). When the ball hits the ground it uses abit more energy in the bounce, the ball compresses a bit and makes a sound. (another source of energy) and the friction caused when the ball bounces back up. These sources of energy all adds up to the 42% of the balls energy that is lost.
Looking at my data and graphs I can definatly see that there is a loss of energy in the ball when it is dropped from a height. More detailed research showed that the energy was lost in the bouce, sound, friction whilst falling and friction whilst bouncing back up in the air loosing roughly 42% of the balls original energy. This is where the energy goes. That is why the ball doesn’t bounce to its original height, because of bounce, sound and friction.