Dependant variable: The Current as this will change because of this.
Control Variable: Keeping this the same throughout the experiment will result in a fair test. They are the Resistance, and the length/thickness of the wire, and length of time.
Hypothesis:
My hypothesis is that the independent variable, the voltage, will change the dependant variable, the current, as voltage is the charge flowing and hence is related to the amount of current. I believe that as I increase the voltage, the current will also increase, the amount of this should be nearly the same as the power is being transferred. Though the current should be slightly lower due to loss of energy through resistance and heat loss.
Equipment:
Wires, Bulb, Ammeter, Voltmeter, Variable resistor, Batteries, stop watch,
Accuracy:
The number and range of settings I will use are from 0 to 10 volts.
To make this experiment a fair test I will keep the control variable the same, this is shown under the variables heading above. Also I will repeat the experiment so that I can produce a more reliable set of results and a better graph to conclude from.
I predict that my results will show that, as I apply more voltage to the circuit; the current will increase. The results will show me how much the relation between the current and voltage is, hence proving or disproving my hypothesis. I have based this prediction on what I know in my scientific knowledge.
Method:
- I set up the equipment as shown in the apparatus diagram.
- I then set the stopwatch to 0, and once I was ready to begin I started the stopwatch at the same time I turned the circuit on. The variable resistor was set to 0.
- I increase the variable resistor every 30 second, in segments so that I get a wide range from 0 to 10 volts.
- Repeat 4 or 5 different voltages to gather more reliable results and compare on table.
- Clear away
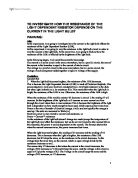
Predicted graph:
The predicted graph above shows that as the voltage increases so does the current. This is based upon my scientific knowledge that the more voltage apply the higher the current is.
Risk Assessment:
The biggest risk to health is the risk of electrocution, this could happen if there were frayed wires, or some of the equipment was damaged sufficiently so that the mains supply was not decreased, thus providing a higher than expected voltage through the circuit at the time of experiment and causing harm to any living organism in its path. Examining all the apparatus before hand, to make sure no faults are present, can control this. Also supervision while conducting the experiment could provide more safety.
Preliminary experiment:
From this experiment I expect to gain a better understanding of how I should carry out the final experiment, thus proving me with more experience and helping with a more detailed conclusion and thorough evaluation.
From conducting my preliminary experiment I have changed my voltage limit from 10 to 12, as I felt I could gather more results in the time allocated for the experiment, thus providing more reliable results. I feel that this adjustment will be worthwhile, and has proved that by doing a preliminary experiment, my final results will be conducted to a higher standard.
Observations
Measurements:
I will measure be changes in current (I) by using an Ammeter to measure Amps; I am measuring this as I can then see how the amount of voltage affects the amount of current. I can measure the voltage (V) in Volts by using a Voltmeter, I will measure to allow me to know how much voltage I am applying to the circuit and allow me to conduct precise results.
Results:
I worked on my own in this experiment so all of my results are my own.
My results are all calculated into 2 Significant figures.
My results seem to be consistent with my earlier expectations.
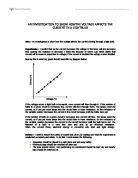
Analysis
The graph shows that as I increased the voltage the current increased also. The graph is a similar shape to my predicted graph. This is that there is a strong positive correlation in the line from both the axis.
This graph means that as the voltage increases so does the current increase, this is shown by the graph corrolation, and by the curvature of the graph indicating that more current is produced with less voltage.
A revised theory from this graph explaining my results and graph is that current seems to increase more than the amount of voltage put in. Creating a curved line.
I believe that my predictions were almost correct, yet now I can see that I made some elementary errors.
Evalutaion:
Advantages and Disadvantages of the experiment are that it went well under planning yet I failed to conclude in sufficient detail, I expected my results and these I gained from my scientific knowledge.
I believe that I could re do the experiment to gain more reliable results, and I have found that the graph shows that my earlier theories were correct. Indecating a well planned prediction.
Patterns in the graph are that the current goes up as the voltage is increased.
Annommalies, I don’t think I have found any anomalies in my graph though if I did find any I would expect to find out that they were caused by incorrect measurements of the results or problems with the equipment, etc.
Aaron Jessop
11H