Method
- Work in groups of 3 – 4.
- First, note down general information about the site such as terrain, aspect, weather conditions etc.
- Draw a field sketch of the site.
- Set up a 20m belt transect running at right angles to the shoreline, from the high water line down to the lowest point possible. (You can use the tide tables to find the time that corresponds to a specific height about chart datum (m) back in the laboratory.)
- Place the quadrat at 2m intervals along the transect. With the help of the ID charts, record the number or percentage cover of each type of organism present.
- Note down any specific features of interest at each quadrat section.
- Between each station, record the changes in the vertical height so that a profile can be drawn.
- Back in the laboratory, rinse the salt water off all the equipment.
- Transfer your data collection in ink and ensure that it is clear.
- Collect a copy of each groups’ data before you analyse your data.
Additional Notes
- It is extremely easy to be dehydrated, so bring a full bottle of water. Wear a hat or sunglasses if necessary.
- Please wear sensible shoes. Slippers and sandals are not recommended.
Results
Raw Data
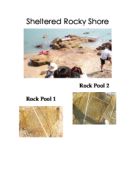
The data collected after our field investigation at the rocky shore at Starfish Bay includes a sketch map of Starfish Bay, a Data Record Sheet and notes made about specific features at each quadrat station.
Please refer to the attachments.
Analysed Data
Using the raw data regarding changes in the vertical height, a profile of the belt transect showing how vertical height changes with the distance along the transect is drawn.
Please refer to the attached graph.
Next, the mean average density of 5 selected organisms at each 2m intervals is calculated, using data from all 3 groups in class. The calculations are presented in the tables below.
Mean Average Density of Organism A
= (Group 1’s data of density of organism A + Group 2’s data of density of organism A + Group 3’s data of density of organism A) / 3
Group 1 – Jireh, Drink, Ivan, Devin
Group 2 – Wendy’s group
Group 3 – Lucia’s group
Table 1: Mean Average Density of Green Algae covering rocks
Table 2: Mean Average Density of Monodonta (Top Shell)
Table 3: Mean Average Density of Perna Viridis (Green Mussels)
Table 4: Mean Average Density of Saccostrea (Rock Osyter)
Table 5: Mean Average Density of Caloplaca sp. (Orange Lichen)
Following on, using the calculations, the analysed data is presented in the form of a kite diagram, which is drawn on the same graph as the profile for easy comparison.
Please refer to the attached graph.
The collected data is also analysed by measuring the dominance and species richness. This is done with the Simpson’s Diversity Index:
D = N (N – 1) / ∑n (n -1)
Where D = Diversity Index,
N = Total no. of organisms of all species found,
n = Number of individuals of a particular species.
Table 6: Simpson’s Diversity Index
In Group 1’s community,
D = 465(464) / [190(189) + 85(84) + 85(84) + 105(104) + 0] = 3.53 (to 3 sig. fig.)
In Group 2’s community,
D = 335(334) / [165(164) + 13(12) + 0 + 0 + 157(156)] = 2.16 (to 3 sig. fig.)
In Group 3’s community,
D = 374(373) / [305(304) + 4(3) + 10(9) + 55(54) + 0] = 1.46 (to 3 sig. fig.)
Discussion
Is there zonation on the rocky shore?
The analysed data shows evidence of zonation on the rocky shore. General trends could be deduced from the kite diagrams, which show differences in distribution of the organisms from the phylas – Lichens, Algae, Mollusca and Crustacea. These are linked to changes in abiotic factors along rocky shore.
In the uppermost part of the transect (0-6 metres), there were mostly shingles (broken shells, rocks and dead organisms). The only organisms present were Caloplaca sp. (Orange Lichen) and Monodonta (Top Shell), which existed only on a very small scale of less than 10%.
An explanation of this is that the abiotic factors discourage settlement of organisms. In this upper zone, furthest away from the tide in terms of height and distance, the area is infrequently wetted, therefore fewer organisms will be washed upon the rocks. This area is also the most exposed and isolated from sea water with intense solar radiation, high temperatures and fast rates of evaporation. Such harsh environment implies that it is unlikely for organisms to survive, as most species cannot live out of water for a long time. The presence of the shingles supports this idea. Caloplaca sp. (orange lichen) is able to exist in this harsher environment because it usually grows on rocks, does not require constant water cover and is adaptable to periods of higher temperatures.
In the high zones of the transect (6-12 metres), all the 5 organisms were present, with Green Algae covering rocks and Saccostrea (rock oysters) as the dominant species.
The abiotic factors are more favourable for survival of organisms in this zone. There is a small stream running in between the boulders and underneath the rocks (as noted down during the investigation). Therefore, there is little exposure above water, and organisms have a source of water for survival. Besides, with the presence of water, temperatures are likely to be lower (water cools the surrounding areas from the heat of the sun). The rocks can act as a shelter from the intense sunlight for the organisms. Such an environment is favourable for Mollusca such as Saccostrea (Rock Oysters).
In the middle zones of the transect (12-18 metres), all the 5 organisms were present and their average densities show higher percentages. The dominant organism is Green Algae covering rocks, where its mean average density reaches 60%.
The abiotic factors here are much more favourable for survival of more active organisms. This zone is more frequently wetted since it occasionally experiences water spray from waves. Although the water stream is no longer visible on the surface, it continues underneath the rocks (as noted down during the investigation). Thus, organisms are not isolated and exposed only to intense solar radiation, temperatures are less extreme. Also, the presence of water (underground water) suggests a relatively lower salinity; and as this zone is closer to the shoreline, there is likely to be a relatively high percentage of dissolved oxygen. These 2 abiotic factors enable the survival of more organisms, particularly algae.
In the lower zones of the transect (18-20 metres), as before, all 5 organisms were present. Monodonta (Top Shell) and Perna Viridis (Green Mussels) are at their highest density. There is a large proportion of Green Algae as well.
This zone is least exposed above water in terms of distance and length of time, making it the zone that is least exposed to sunlight. Temperatures are likely to be closer to water temperatures. These abiotic factors make it more favourable for survival of the organisms. There is greater species diversity, as hermit crabs and shrimps were also found (as noted down during the investigation).
The lowest zone of the transect (20-24 metres) is actually immersed under water. Only Saccostrea (Rock Oysters) and Perna Viridis (Green Mussels) are present.
Here, the abiotic conditions are most favourable for oysters and mussels. This 2 species survive easily underwater, where there are high levels of dissolved oxygen and lower levels of salinity. In fact, Mollusca, Cnidaria and crabs are very common in this zone. Moreover, in this zone, there is greatest species diversity – rock and hammer oysters, periwinkles, sea cucumbers, sea anemones and sea corals were all found alive (as noted down during the investigation).
As a conclusion, the hypothesis that zonation is present on the rocky shore at Starfish Bay is supported. There are zones with distinct distribution of species.
Comparing results of this investigation with other investigations on rocky shore zonation
The results of this investigation are quite similar to that of other findings or published data on rocky shore zonation. For instance, research on rocky shore inter-tidal zonation along the Northwest coast in Britain show that the upper zones are characterised with the presence of lichens; in the middle zones, organisms existing are barnacles, mussels and algae; while in the lower zones, there are sea anemones, crabs and sea cucumbers (as examples).
The Simpson’s Diversity Index
This is a measure of species dominance and richness. The higher the diversity index, the higher the species richness, the more stable the site. From the analysed data, the community from Group 1’s transect has the greatest species diversity as its diversity index is the highest among the 3 groups. Indeed, many species were identified along the transect (though they are not represented in the kite diagrams). These include hermit crabs, shrimps, hammer oysters, rock oysters, green mussels, top shells, nerita, periwinkles, barnacles, sea anemones, sea cucumbers, sea corals, worms, snails and marine cockroaches etc. With such high biodiversity, there is more recycling of nutrients, more productivity and so greater ecosystem stability. Little pollution and human interference is a possible reason for the existence of the diverse community in Starfish Bay. This is because in recent years, more measures have been taken by the Hong Kong Government to conserve the environment and special ecosystems like the sandy shore and rocky shore on Starfish Bay.
Evaluation
The investigation was in general successful, useful data was collected and supported the hypothesis, but there could be improvements. First of all, the method adopted allowed for sources of error to occur. Although for the data analysis, the mean average density was calculated using the data collected from all the other groups in class, the method of using line transects and sampling at 2 metre intervals does not give the best thorough coverage of the distribution of organisms on the rocky shore. Line transects samples at intervals only along one single line; there is a possibility that it was conducted over an isolated and peculiar situation which is different from the rest of the rocky shore. If this is the case, samples taken only gives a narrow and unrealistic view of the actual situation, and cannot reflect all the changes in density and community composition. Data collected is therefore not very reliable.
To solve this problem, the transect sampling interval could be narrowed down from 2 metres to 1 metre. This will narrow down in greater detail the data collection, which might be more sufficient to accurately sample a community. In addition, belt transects can be conducted instead of line transects. Belt transects are performed on a wider scale along several lines of transects with continuous quadrat sampling. This provides more information on community composition as it. However, belt transects can be difficult to carry out and are quite time-consuming.
Secondly, the validity of the results should be questioned. Being inexperienced and carrying out the investigation for the first time, the data collected is not likely to be the most accurate. The organisms and their names were unfamiliar, so the process identifying organisms was inefficient. It was rather difficult to estimate the percentage cover of organisms along the transect even with a quadrat, it is thus likely that wrong estimations were made which directly affects the data analysis. The fact that data is collected through estimations makes the results doubtful.
A possible solution is to ‘rehearse’ for the investigation, to try out the experiment once before the actual investigation so that students can familiarize with the procedure and the apparatus. This will better prepare for the actual data collection, and hopefully it will be more accurate. Nonetheless, this requires more time and effort.
Thirdly, the analysis of raw data was not the most comprehensive. Out of the 5 organisms selected for the construction of kite diagrams, only 4 phylas (Lichens, Algao, Mollusca and Crustacea) were represented. The phyla Cnidaria was not represented, so analysis was not thorough enough. For instance, Actinia equine (Sea Anemone), which belongs to the Cnicaria phyla, was not represented, but it would have been useful to include it in the kite diagrams. This is because it can stand for the distribution of species alike which survive in the lower zones (least exposure above water, least amounts of sunlight), and this information is important evidence for zonation.
To avoid this, one organism should be selected from all the 5 phylas so that there will be a wider coverage and better representation for discussion and comparison. Such measures would further engage students into the investigation, and hence allow for a better understanding about zonation on the rocky shore at Starfish Bay.
Bibliography
- David W. Connor, James H. Allen, Neil Golding, Louise M. Lieberknecht, Kate O. Northen & Johnny B. Reker
The National Marine Habitat Classification for Britain and Ireland (Version 03.02)
© 2003 Copyright JNCC, Peterborough
ISBN 1 86107 546 4 (internet version)
President, Earth Education and Research; Adjunct Professor of Human Ecology; St. Andrews Presbyterian College
Living in the Environment - Principles, Connections and Solutions (13th Edition)
© 2004 Brooks/Cole, a division of Thompson Learning, Inc.
Biozone International 2001-2003
Tjärnö Marine Biological Laboratory, Strömstad, Sweden (2000)
“Zonation on a Rocky Shore”
© 1997-2003 British Marine Life Study Society
From Wikipedia, the free encyclopedia.
Source: Li Po Chun United World College of Hong Kong
Homepage (Location Map)
David W. Connor, James H. Allen, Neil Golding, Louise M. Lieberknecht, Kate O. Northen & Johnny B. Reker.
The National Marine Habitat Classification for Britain and Ireland.