Critically evaluate the perceived competitive starategies of the five clothing retail outlets, namely Edgars, PEP stores, Mr Price, Truworths and Ackermans.
Syndicate Assignment
Group 3 - Wild West
MBA Stage 1
Management at the Functional Level
Tania H. Adendorff ( mb20030000 )
Michael O.Visser ( mb20030000 )
Lorna Skhosana ( mb20030075 )
Keith Michael( mb20030065 )
Craig Rosewarne( mb20030015 )
Farouk Dawood ( mb20029925 )
20 May 2003
MFL 01 - Syndicate Assignment 20 May 2003
Synopsis
The assignment will attempt to critically evaluate the perceived competitive starategies of the five clothing retail outlets, namely Edgars, PEP stores, Mr Price, Truworths and Ackermans.
Competitive strategy analysis was based on customers perception of competitive performance of each retail outlet. The collection and interpretation of data was conducted by means of the qualitative research methodology ( ref. ) . The representative of the population was made up of six MBA Students making up the syndicate group.
The primary source of data was provided by the students, additional data and information was obtained from textbooks, internet, academic journals and various library sources.
The primary source of information was obtained from questionnaires completed by students throught personal visits, Open session discussions and workshops were held to gain understanding and consensus on the approach, targets segments and methodology to be used for research.
The first section of the assignment is focused on analyzing the retail clothing environment using PESTLE method to understand the extent and impact of various factors on the competitive performance .
The next section examined the competitive strategies of each retail outlet and used Porters 5 forces to interpret and position outlets.
The third section is focused on the practical research conducted , consisting of collection, analysis, interpretation of data and conclusions.
Conclusions:
Students were able to obtain competitive strategies of some outlets, but other outlets restricted access to their strategies. Edcon for example published their chairmans report on the internet and were quite about their starategies.
Table of Contents
Introduction
. Industry Analysis
1.1 Pestel Analysis
* Political Environment
* Economic Environment
* Social Environment
* Technology
* Legal
* Environment (Ecology)
.2 Competitive Environment Analysis (Porters)
.2.1 Barriers to Entry
1.2.2 Rivalry among Existing Competitors
1.2.3 Threat of Substitutes
1.2.4 Power of Buyers
1.2.5 Bargaining power of Suppliers
2. Competitive Strategy - Role of Performance Objectives
2.1 Levels of Strategy
2.2 Competitive positioning within the industry
2.3 Types of Competition specific to clothing retail
2.4 Operation's Performance Objectives
2.5 Measuring Performance against Objectives
3. Research
3.1 Objectives of research
3.1.1 Problem definition
3.1.2 Hypothesis
3.1.3 Delimitation
3.1.4 Definition of terms
3.2 Research Methodology
3.2.1
3.3 Processing Data
3.4. Summary of Data
4. Critical Analysis of the research and its limitations
5. Conclusions
6. Recommendations
7. Appendix
8. References
Introduction
Due to the increasingly discretionary nature of consumers, the apparal sector is less stable than the food and grocery sector and more fragmented. Major clothing chains, including Edgars, Pep. Woolworths, Truworths, Mr price, Ackermans, Speciality Stores, Rag and Hypermarkets, account for 80% of the market. Operating margins in the clothing retail sector are better at between 4% and 16% in 2002. Nevertheless they have shown noticeable declines over the last five years, reflecting the high increase in discounting and increased low-end competition. The recent decline in interest rates, increased urbanization and the emerging black middle class are all factors that spur growth in the retail sector.
. Environmental Factors
Market pressure has been exacerbated by low per capita incomes, the breakdown of the central business districts, low operating margins and changing shopping habits. In the 1990s, South Africans started to divert their disposable income to cellular phones, gambling, the lottery, security costs, medical aid, insurance and school fees. Some SA companies are looking to international markets for expansion and have acquired international and overseas outlets. Shoprite's expansion into Africa, for example, has gained momentum since the mid-nineties. Holding company, Pepkor, sees Africa as offering enormous potential for businesses with the market positioning of its operating units. While expansion outside SA was tentative at first, the experience gained during the last few years has prompted larger and more decisive initiatives. Key Issues: e-Retail | Inventory Control | Diversification In reaction to changing spending patterns, retailers are now offering a raft of new products, including cellular airtime and accessories and financial services. Pick 'n Pay have its own financial services division. Clothing retailers have been offering financial services -- in the form of credit -- for years. These have become increasingly sophisticated to include insurance, unit trusts and personal loans. Woolworths offers unit trusts, amongst other financial products. However, analysts say retailers are essentially competing for the same Rand. There are few barriers to entry, other than distribution and it can only be a matter of time before the market becomes saturated. For More Info A C Nielsen Tel +27 11 495 3000 | Fax +27 11 835 3410 Email
[email protected] | Web www.acnielsen.com CA Ratings Tel +27 11 442 4233 | Fax +27 11 442 4236 Email
[email protected] Grocery Manufacturers Association of SA Tel +27 11 886 3008 | Fax +27 11 886 5375 Email
[email protected] Institute of Purchasing & Supply SA Tel +27 11 833 6221 | Fax +27 11 833 6224 Email
[email protected] | Web www.ipsa.co.za
Forecast of economic indicators and retail sales by product group for 2003 - BMR
The Bureau of Market Research (BMR) at the University of South Africa (Unisa) forecasts a real growth rate of 3,2 % in the formal retail trade in 2003 compared to 5,6 % in 2002. Compared to 2002, retail sales are expected to deteriorate as a result of the tightening of the interest rate environment in 2002.
As consumers are expected to curtail spending in order to absorb interest rate increases, retail sales are expected to be lower especially during the first part of 2003. Whereas the real growth in sales of nondurable retail goods is anticipated to increase by 1,3 %, real growth rates of 5,9 % and 4,3 % are expected for sales of semidurable and durable retail goods in 2003.
The BMR also forecasts an increase of 3,3 % in real economic growth for 2003 while private consumption expenditure is set to grow at 3,4 % in 2003. The latter growth is anticipated against the background of, among others, expected lower personal taxes especially among low and medium income groups, a relatively stable interest and exchange rate environment, structurally lower inflation, macroeconomic stability and lower foreign debt.
Potential risk factors that could culminate into less optimistic growth prospects for 2003 include, among others, skills shortages, local political conflict, USA/Iraq conflict, large scale economic/financial instability in emerging markets, and political and economic problems facing Africa.
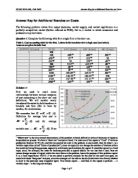
The BMR anticipates that private consumption expenditure on formal retail trade products will vary across product ranges. Whereas formal retail sales of footwear, clothing, household furniture, domestic appliances, TVs & DVDs and kitchenware are expected to increase by more than 6 % in 2003, formal retail sales of inedible groceries, alcoholic and nonalcoholic beverages, domestic textiles, books and jewellery are expected to decrease (figure 1).
FIGURE 1: REAL GROWTH OF FORMAL RETAIL TRADE SALES BY SELECTED PRODUCT GROUP, 2003
On average, the price of retail products in 2003 is anticipated to increase by 8,1 %. Increases of more than 10 % are anticipated in the prices of glass and crockery, books, magazines and stationery and pharmaceutical and medical products.
The distribution of formal retail sales over a twelve month period according to product group shows the lowest percentage sales for household furniture in January (5,8 % of the total), while the highest sales are reflected for jewellery, silverware, watches and precious stones in December (17,6 % of the total).
Information according to population group indicates that blacks will be responsible for 58,5 % of total formal retail sales in 2003 (figure 2) and their share may be as high as 72,8 % in household furniture but as low as 23,2 % in sport and recreation requisites.
FIGURE 2: PERCENTAGE SHARE IN RETAIL TRADE SALES BY POPULATION GROUP, 2003
FORECAST OF ECONOMIC INDICATORS AND FORMAL RETAIL SALES BY PRODUCT GROUP FOR 2003 (Research Report no 312) was compiled by DH Tustin, Senior Researcher of the Bureau of Market Research. The report, consisting of 84 pages, is available from the Bureau of Market Research, PO Box 392, UNISA 0003.
Pearce &Robinson ( 2000 ) categorises the environmental factors into the remote environment ( PEST ), industry environment and operation environment. Narayanan et al. (1985) points out that the remote environment can be broken down into four factors, namely; political, economic, social and technological
* Political factors
The political factors comprise of political processes and regulatory institutions that shape the code of conduct in a society. ( Narayanan et al 1985).
Accordingly to Johnson & Scholes ( 1999) political factors influencing the direction of a firm include monopolies, environment protection laws, taxation, taxing policies, foreign trade regulations, employment and government stability.
South Africa
TEXTILE AND APPAREL INDUSTRY
INTERNATIONAL COPYRIGHT, U.S. & FOREIGN COMMERCIAL SERVICE AND
U.S. DEPARTMENT OF STATE, 1998. ALL RIGHTS RESERVED OUTSIDE OF
THE UNITED STATES
SUMMARY
The textile and ...
This is a preview of the whole essay
* Political factors
The political factors comprise of political processes and regulatory institutions that shape the code of conduct in a society. ( Narayanan et al 1985).
Accordingly to Johnson & Scholes ( 1999) political factors influencing the direction of a firm include monopolies, environment protection laws, taxation, taxing policies, foreign trade regulations, employment and government stability.
South Africa
TEXTILE AND APPAREL INDUSTRY
INTERNATIONAL COPYRIGHT, U.S. & FOREIGN COMMERCIAL SERVICE AND
U.S. DEPARTMENT OF STATE, 1998. ALL RIGHTS RESERVED OUTSIDE OF
THE UNITED STATES
SUMMARY
The textile and apparel industry is South Africa's sixth largest
the manufacturing sector employer and eleventh largest exporter
of manufactured goods. After the mines, it is the second largest
user of electricity and second largest source of tax revenue.
The textile and apparel industry directly employs 230,000 and
another 200,000 in dependent industries such as transport and
packaging. The Industrial Development Corporation (IDC) has
calculated that for every worker in the textile industry, 2.5
jobs are generated in related industries.
In 1997, total South African retail apparel sales exceeded R24.1
billion. This figure represents a 258% increase in retail sales
since 1990 and a 146% growth since the elections in 1994. In
997, the textile industry sales were R 11.9 billion.
Economy
The current volatility of global financial markets and
realignments of emerging market economies has impacted on South
Africa heavily, making the government's ambitious reform and
restructuring process difficult. The Asian Financial Crisis hit
South Africa particularly hard, as Japan and Taiwan are South
Africa's two largest trade and investment partners. As a direct
result, the South African Rand has lost 25 percent of its value
against the dollar since January 1998. South Africa is
experiencing an economic slowdown, which began in the 3rd quarter
of 1997. During the second quarter of 1998, GDP increased at .03
percent. Current conditions suggest that the economic slowdown
will continue into 1999. The economic slowdown combined with the
dollar/rand exchange rate may present challenges to U.S.
companies seeking to export to South Africa.
South Africa is, at once, a first world and a third-world economy
living side by side.
Per capita income statistics may be misleading unless the
substantial gap between reasonably well-off middle class and the
masses of poor are taken into account.
Tariff Structure
In 1992, the South African Government instituted a program to
drastically reduce tariffs for textiles and apparels over a
twelve-year period. The tariff reduction timetable gives the
non-competitive domestic producers a grace period in which to
increase efficiency. Textile tariffs will be reduced over twelve
years from 100% to 45% on clothing, from 50% to 25% on fabrics,
from 35% to 17.5% on yarn, from 15% to 10% on fibers, and from
60% to 30% on household textiles.
South African Customs Union Textiles and Clothing: Tariff
Phase-Down Program *1992*1993*1994*1995*1996*1997*1998*1999*2000*2001*2002**
Synthetic fiber *15%*25%*25%*23%*21%*19%*17%*15%*13%*11%*7.5%**
yarn *35%*32%*32%*30%*28%*26%*24%*22%*29%*18%*15%**
fabric *50%*45%*45%*42%*39%*36%*33%*30%*27%*24%*22%**
Clothing *100%*90%*90%*84%*78%*72%*66%*60%*54%*47%*40%**
Household made-up
textiles *60%*55%*55%*52%*49%*46%*43%*40%*37%*34%*30%**
Source: South African Government, Department of Trade and Industry
Although the government seems intent on conforming to the
standards of the WTO, the legacy of an import substitution policy
supported by high tariffs and import permits has left the South
African apparel industry largely non-competitive on the world
market. Due to this lack of competitiveness coupled with the
high unemployment rate in South Africa, the government has
vigorously explored WTO-permissible supply-side measures designed
to facilitate worker re-training and technological innovation.
Market Access
Since 1989, when import penetration escalated to around 40% of
local production, import control measures were removed and tariff
levels were reduced. The Structural Adjustment Program (SAP),
which for years offered duty-free imports based on export
volumes, was introduced in 1989. At the same time, the General
Export Incentive Scheme (GEIS) was introduced which offered
textile manufacturers an export incentive based on the export
value. In 1994, the Duty Credit Certificate (DCC) which offers a
customs duty credit for export performance replaced SAP.
The South African Textiles and Apparel Industry has embraced the
General Agreement of Trade and Tariffs (GATT) and the philosophy
of trade liberalization and is striving to become more efficient
and competitive. The textile industry has plans to dedicate R3
billion of investment over a five-year period. Large capital
investments have already been made and the improving financial
performance of some of the industry's major companies provides
concrete evidence of the textile industry's determination to
succeed.
Possibility of quota-free and duty-free U.S. entry of Sub-Saharan
African textiles and apparel Legislation introduced into the U.S.
Congress in 1997, the African Growth and Opportunity Act, would
eliminate quotas and duties on all Sub-Saharan African textiles
and apparel. This region includes South Africa. If both quotas
and tariffs were removed, the U.S. International Trade Commission
estimates U.S. imports of apparel from Sub-Saharan Africa would
increase by $100-$175 million. For textiles, it is estimated
that the removal of duties would result in an increase in U.S.
imports from $2.5-$4 million. This influx of capital into
Sub-Saharan Africa, may provide South African firms with capital
to purchase U.S. products.
Market Assessment
Following the long period of stability, the sharp decline in the
value of the Rand since mid-February 1996 has caught analysts by
surprise and nullified most forecasts of the exchange rate. The
devaluation of the Rand, from 3.65/USD in 1995 to 6.5/USD in
September 1998, gave the South African textile industry a
short-term advantage against imports. The price of imported
textiles will rise and make local textiles more attractive to
purchasers. The exchange rate adjustment will also enable
exporters to achieve genuine profit margins without having to
depend of GEIS and DCC export incentive schemes. This will not,
however, make up for the unilateral decision by the government to
slice GEIS benefits by one half and to impose new conditions on
the DCC scheme participants.
Factors that will influence the manufacturing industry in general
and the textile industry in particular will include: political
stability, labor relations, wage controls, training, new
technology, research and development, competition (local and
international) and the cost of money.
Interest rates and exchange rates will have an effect on new
capital investments and upgrading of technology. Inflation has
fallen from double digit to 6 percent. Real interest rates have
dropped but are still high by international standards at 25.5 in
September 1998.
Companies willing to make a 5-10 year investment in South Africa
will enter into a market with huge potential. American firms
must be willing to invest in infrastructure, computers and
logistic capability and be willing to market a specific brand to
create product demand.
Apparel Industry
In 1995, the South African apparel industry had actual sales of
approximately $2 billion accounting for approximately 3.7% of
GDP. The apparel industry employs approximately 170,000 directly
and an additional 200,000 indirectly. In 1995, South Africa
imported approximately $103 million and exported approximately
$123 million apparel products. The South African apparel
industry has vast export potential. In 1995, world apparel
exports totaled $170 billion and South Africa captured less than
one percent.
South Africa experienced a huge increase in smuggling and fraud
which needs to be effectively controlled through customs patrol.
More efficient and effective control could be achieved by
improving systems and procedures, rather than increasingly the
amounts of human and capital resources to the problem.
South Africans spend, on average, 7 percent of their annual
income on clothing.
Imports and Exports of Textiles
The change in the unit of measurement for fabrics from square
meters to kgs makes it difficult to directly compare imports of
fabrics during 1995 and 1996 with previous years. It appears
that imports of yarns stabilized during 1996, being slightly
higher than in 1995. However, imports of yarns under rebate of
duty increased. It is expected that this trend will continue.
During 1996, 45% of the total volume of yarns imported into the
country were cleared under rebate of duty. Approximately 60% of
all imported yarns were man-made filament yarns and 20% were
yarns of man-made staple fibers.
During 1996, the total value of textile imports (R3.54 billion)
was 5.1% higher than in 1995. The value of clothing imports
increased by 65.8% from 1995-1996. Turkey supplies 30% of all
imported textile.
Outlook
The continuing weakness of the Rand might inhibit importers from
placing orders overseas. The total textile industry will suffer
from business lost to duty-free imports due to the various rebate
facilities, fraudulent imports and possible increased imports due
to the general reduction in customs duties.
Volume of production will be under pressure. Soft consumer
demand and reduced disposable income will lead to fierce price
competition and therefore a decline in local sales is expected.
It is expected that exports of South African textiles will
increase as a result of the weak Rand and the fact that South
African manufacturers are increasingly breaking into foreign
markets.
Although production costs will be under pressure, an increase is
expected due to increases in the price of raw material and higher
wages. It is expected that technology and machinery will
continue to be upgraded which will improve quality and
productivity.
Best Sales Prospects - Textiles
Textile machinery remains a significant potential market for U.S.
companies. While South African import figures are not available
for textile machinery and equipment imported from the U.S., the
following areas have been identified by the textile industry as
having the best potential for U.S. exporters:
Spinning and Twisting Machinery for Natural and Man-made fibers.
Winding and Reeling Machinery.
Weaving and Weaving Preparatory Machinery.
Knitting and Hosiery Machinery.
Bleaching, Dying, Printing and Make-up Machinery.
In addition, the following service areas are of major concern and
importance to the Textile Industry:
Training and skills development.
Technology upgrades.
Small Business Development.
Industry Database.
Textile Consultants.
Best Sales Prospects u Apparel
A leading South African Department Store chain and an industry
association stated that the combination of the existing tariffs
and unfavorable exchange rate made U.S. apparel quite expensive
for the South African market. In order to be price competitive,
many retail outlets source from the Far East where American
styles are imitated.
Opportunities for high-end U.S. manufacturers lie with boutiques,
rather than department store chains. South Africans are very
brand conscious and a strong niche market exists for designer
labels. The following areas have been identified by apparel
retailers and manufacturers as having the best potential for U.S.
exporters:
There may be an opportunity for off-season merchandise because
South Africa's are opposite those in the U.S.
Opportunities exist for licensing agreements to manufacture U.S.
branded products in South Africa.
U.S. apparel has a reputation in South Africa for superior
quality. South Africans are prepared to pay top dollar for
American products because they get value from American products.
South African consumers follow U.S. fashion and culture very
closely. The "American image" sells.
Additional Opportunities for American Apparel companies
American consulting firms could teach South African retailers,
designers and merchandisers U.S. marketing practices.
Joint Venture opportunities exist and, in light of the current
economic condition, may be the advisable strategy for companies
interested in a long-term presence in South Africa.
Retailers may be interested in establishing partnerships with
U.S. department store chains.
* Economic factors
Kotler & Armstrong (1999) point out that markets require purchasing power as well as people
"It's becoming a natural progression for us to move farther and
farther north," said Dan Barrett, managing director of the Durban-based
discount chain. "You can dominate a market pretty quickly."
Once rejected as the economic storm troopers of white-minority
rule and rapacious Western capitalism, South African businesses are cutting
a path through the continent in a move that underscores this country's
emergence as Africa's economic powerhouse.
Led by the gold- and diamond-mining houses that have long been
the vanguard of its multinational economic power, the expansion of South
African business ties on the continent has spread into a host of other
sectors.
South African fast-food shops and clothing stores are in
Zimbabwe. Its national brewer, South African Breweries, is in eight African
countries, including Uganda, where it purchased a controlling stake in a
brewery last month. A South African cable TV network, Multichoice, can be
viewed as far north as Kenya. South African supermarket chains are sprouting
in Zambia and Mozambique, and all over the continent one can find South
African hotels, banks, restaurant chains, construction companies, rail and
road engineering projects, sugar processors, paper manufacturers, mineral,
oil and gas exploration efforts, even auto service centers.
Since 1990, direct foreign investment by South Africa's private
sector has increased at least threefold, to $25 billion in 1995, the latest
year for which figures are available. Investments in Africa account for a
small portion of this total, but foreign exchange requests in the pipeline
indicate that Africa's share will grow dramatically, an official of the
South African Reserve Bank said.
Among shoppers, demand for the growing South African presence is
high. In August, when a Shoprite Checkers supermarket food chain opened in
Maputo, the Mozambican capital, a near riot reportedly broke out amid the
crush of the thousands clamoring for the grand opening sale.
Governments are clamoring too -- for investment. Kenya's
officials recently appealed for more, in part to help level its trade
imbalance with Pretoria. In Zambia, which has virtually rolled out the red
carpet to all comers as part of its privatization drive, recent figures show
that South African firms have overtaken the British to become the leading
foreign business licensees. Angola was a Cold War enemy of South Africa, yet
Angolan business officials are running ads in South African newspapers
inviting joint venture investors.
The move northward is not without complications. Though some
governments have adopted investor-friendly policies such as easing
restrictions on foreign ownership and offering incentives for business
development, bureaucratic red tape is an obstacle -- as are the suspicions
that some governments harbor about their economic big brother to the south.
On the South African side there are drawbacks as well. Mining
houses and other large corporations aside, South African business is not
accustomed to dealing with the outside world after years of isolation
brought about by international sanctions aimed at ending apartheid. Its
learning curve adds costs to doing business in a world where it was long
rejected.
As South Africa emerges after dismantling apartheid, it has
become not only a target of the economic trend toward globalization, but a
player in it as well.
"If we make a success here economically, then the rest of Africa
will certainly benefit," said Erich Leistner, a research fellow at the
Africa Institute.
The South African investment trend has been growing since 1993,
just after passage of an interim constitution signaled the death knell of
apartheid and brought an end to sanctions.
The formal introduction of nonracial democracy the following
year led to the gradual lifting of South African currency controls that
prohibited foreign investment, which in turn brought the opening of the
country's economy to the world.
Under a democratic, black-led, relatively free-market
government, South African firms are far more welcome on the continent than
they were in the days when business here symbolized racist rule. Although
big business in South Africa remains largely white, on a continent in
desperate need of economic development after years of stagnation, it is the
color of money that speaks more loudly.
South Africa's economy is four times larger than those of its
southern African neighbors combined, and its industrial base is relatively
diversified. While most of Africa comprises developing, Third World
countries, South Africa straddles the Third World and the First. It is an
emerging market with deep socioeconomic needs, but with sectors that already
have emerged into the global economy.
Analysts say it is important for South Africa to invest in
Africa, especially southern Africa, to strengthen its natural export
markets. In addition, some South African businesses have saturated their
domestic markets and need to expand to remain viable.
To facilitate regional development, the South African Reserve
Bank, which administers the nation's protective controls on the movement of
the national currency, the rand, gives preference to investors targeting
southern Africa. Firms now are allowed to move into foreign direct
investment the equivalent of $10.5 million for each new project -- not a
huge sum, but more than before. The reserve bank also issued a rule recently
that allows South African firms to use their domestic cash reserves as
security for foreign financing for outward investment.
African countries want what South Africa has to offer, but some
resent the inherently unequal nature of trade and business deals with this
economic behemoth. South Africa's exports to its neighbors are six times
greater than its imports from them and are heavily weighted to manufactured
goods that other countries do not produce or do not produce efficiently.
Though some of South Africa's trading partners have reduced their tariffs
substantially to ease trade in the region, South Africa -- with its
export-driven growth strategy -- has been reluctant to make it too easy for
imports from the region to get in.
Margarida Martins, a Mozambican who coordinates several "spatial
development initiatives" along key business and transport corridors in
southern Africa, said the fear of South African domination "is continually
coming up" in her presentations to governments.
"Officially, they all give green lights," she said. "But when
you start coming to details, then you have certain sensitivities. What is
the role of South Africa? Are they coming in?"
Said Game Stores' Barrett: "There's a certain amount of fear
north of South Africa that South African business will come in and just roll
over their local business, which is a valid fear. But at the end of the day,
you can't hold back the world."
Anthony Wright, general manager of Standard Bank of South
Africa's Africa Banking Group, said one of the legacies of African
countries' post-independence embrace of socialism and command economies is
that " `profit' is a dirty word."
South Africa's Standard Bank has expanded, largely through the
purchase of a British bank, into 14 African countries since 1992. In some,
there are rules that govern the remittance of dividends or require a high
level of local employees.
Other challenges or drawbacks to investing in Africa include
government instability and armed conflict. And even in times of peace,
communication systems in much of the continent are poor. Standard Bank, for
instance, plans to link all of its continental branches via a satellite
because African telecommunications systems are not sophisticated enough for
global banking.
But the problems of investing in Africa are not just up north:
Because of South Africa's long international isolation, for instance,
bankers here are accustomed to dealing in only the local currency and are
less well-versed in the juggling of foreign exchange deals, which are part
and parcel of international banking and finance.
"So when you buy a business up in Africa, it's very difficult to
find [South African] guys with the right kind of expertise," said Wright,
who is British. "We're part of the global village up north, but not in South
Africa."
* Social factors
The social-cultural environment represents the values, beliefs, opinions, lifestyles and the general behavior of persons in the firm's external environment - Pearce et al (2000).
The recent decline in interest rates, increased urbanization and the emerging black middle class are all factors that spur growth in the retail sector. With consumer confidence in positive territory in January 2001 and positive sales in the second quarter of 2001, for the first time in 18 months, the predictions for sales in 2001 are optimistic. Nevertheless, the financial turmoil of the post 1995 period, accompanied by continued high interest rates, high consumer debt and the lower supply rate of new credit cards has taken its toll on the retail sector. Market pressure has been exacerbated by low per capita incomes, the breakdown of the central business districts, low operating margins and changing shopping habits. In the 1990s, South Africans started to divert their disposable income to cellular phones, gambling, the lottery, security costs, medical aid, insurance and school fees
DeLange (2001) argues that unemployment has grown disastrously, and there has been increasing polarization between the rich and poor. He asserts that these factors have given rise to an increasingly intolerable growth in crime levels and a breakdown of traditional patterns of social and community organization.As a result, the clothing retail industry is plagued by problems of shrinkage, pilferage and fraudulent transactions.
* Technological Factors
Pearce et al. (2000) points out that, to avoid obsolescence and provide innovation, firms must be aware of technology changes that may influence their industry.
Two of the major grocery retail groups, Pick 'n Pay and Wooltru, launched high-profile e-retail initiatives in 2000. The first six months of trading on the Wooltru site, Inthebag, met expectations and Wooltru was committed to funding Inthebag until June 2001. Limited PC-based infrastructure and basic logistics and fulfillment mechanisms are among the major challenges facing online retailing in SA but online trading is gaining momentum and the outlook is positive. While South African online purchasing figures are generally below global averages, in almost every instance, SA is ahead of the 2000 global averages. Furthermore, the relatively slow development of online shopping is a potential blessing in disguise, giving retailers an opportunity to bypass the exploratory and developmental stages and focus immediately on effective multi-channel retailing. Another challenge for retailers is to improve stockholding and inventory control. To achieve this efficiently, while containing distribution costs, most large chains have invested in major information technology upgrades in recent years and this investment continues.
According to Doherty, Ellis-Chadwick & Hart (1999) the retail sector provides an obvious route for development
3.2 Competitive Environment Analysis ( Porter's Analysis )
While PEST analysis were able to deliver a fairly broad understanding of external influences there are also other forces which determine the competitive balance within the specific industry ( Lynch, 1997 )
2 important factors - attractiveness of the industry, and relative position within that industry ( Porter (1998 ))
Attractiveness of the industry - determines the profitability of a firm and the ability to sustain it over a long period of time. It can be measured in terms of facilitating the development of competitive advantage and delivering value to the customer and to the company.
Competitive Position - is about a firm's position within that industry as compared to others and will determine profitability.
Attractiveness of the industry is a reflection of factors over which a company has little influence; Competitive positioning on the other hand, will be determined by the competitive strategy.
The choice of strategy chosen by a firm can make an industry more or less attractive.
Before a company can develop its competitive strategy, it has to first analyse and understand the rules of competition within the industry in which it competes. The ultimate aim of the strategy will be to cope and ideally change those rules to firm's favour ( Porter, 1998 ),
The retail clothing outlets will be analysed for attractiveness and profitabity using Porters 5 forces.
PORTERS 5 FORCES
Suppliers
* VMS out sources it's manufacturing to 2 separate companies.
* VMS is extremely dependant on each of it's suppliers.
Buyers
* Buyers in fairly strong position as there are more voice capable router options
* Buyers very well informed, using the Internet and references to compare vendors and if happy then options considered based on price & delivery.
Substitutes
* There is a slight threat from next generation of switchboards, but still minimal.
Competitors - Intensity of Rivalry
* Risk from competitors is fairly high
* However, due to price advantages, risk is decreased
* Little "brand" identity with most clients assessing on price & delivery comparisons.
New Entrants
* Entry barriers medium
5.4 STRENGTHS & WEAKNESSES
Strengths:
Weaknesses:
VMS leading vendor in Voice technology
VMS not known as a major network player
Established Voice sites
Few qualified resellers
Pricing is very competitive
Perceived lack of support
Warranty is longer - 1 year versus 3 months
No local presence
2.2.1 The threat of new entrants
New entrants to the retail clothing industry can bring new capacity, the desire to gain market share and often substantial resources. The seriousness of this threat depends on the barriers to entry and the anticipated retaliation from existing competition(Porter, 1991). The main barriers, within the retail clothing are economies of scale delivered by geographic coverage of the population, location of retail outlets, relationship with main suppliers, selection of brands and marketing.
2.2.2 The threat of substitute products
The threat of substitute products determines the extent to which other products can meet buyers needs and therefore place a ceiling on how much a buyer is willing to pay ( Porter, 1998).
Flea-markets, Chinese products, imported goods
2.2.3 Threat of competitive rivalry
According to Porter (1985), competition is at the core of the success or failure of firms. The intensity of rivalry will determine the extent to which competing companies will give away the value that they have created. They will either pass this value to the buyer in lower prices or it will be absorbed by higher costs of competing (Porter, 1991).
Company's survival and growth in such market depends on its ability to differentiate and to innovate(Porter, 1991).
2.2.4 Power of Buyers
Industry's customers constantly look for reduced prices, improved quality and best services which affect the level of competition(Pearce et al. (2000))
2.2.5 Bargaining Power of suppliers
The bargaining power of suppliers determines to which extent value created will be retained by suppliers (Porter,1998).
Figure: Porters model applied to the clothing retail industry
(Source: Porter. M. E. (1985) Competitive advantage: Creating and sustaining superior performance. New York: The Free Press)
3.3 Competitive Strategy
Strategy is a mechanism that companies use to determinehow, when, and where it should compete ( Pierce & Robinson, 2000). Thus without strategy a company would become stagnant and eventually die. According to Mintzberg & quinn (1992) Strategies are use in both single-minded enterprises andas well as in large diversified enterprises.
The 4 levels of strategy are as follows:
a. Corporate - group wide or company wide strategies,
Decisions such as ; diversification, joint-ventures, outsourcing, created or closing down business units and
Investment sourcing and funding.
Consider global,economic, political and social environment.
b. Business - The strategies for each business unit can be similar or
very different on the industry focus, target segments. Ultimate each SBU's strategy must be driven by the corporate strategy.
Developing responses to the changes in the industry, the global economy, the political and regulatory arena, etc
c. Functional - Relate to the operations, marketing, finance and human
resource functions. According to Mintzberg et al.1992), a company needs a functional strategy for every major unit or department in the business. The main role of functional starategies is to support the company's overall business strategy and competitive approach ( Thompson & Strickland, 1995).
d. Operational - Concerns the pattern of strategic decisions and actions which set the role, objectives and activities of the operation.
Figure :
The four perspectives on operations strategy
(Source: Slack,N., Stuart,C., Johsnton,R. 2003)
Top-down - what the whole group or business wants to do
Bottom-up - where operations improvements cumulatively build strategy
Operations Strategy - involves translating market requirements into operations decisions
Operations resource - involves exploiting the capabilities of operations resource in
chosen markets
None of these four perspectives alone gives the full picture of what operations strategy is. But together they provide some ideas of the pressures which go to form the content of operations strategy.
Competitive Positioning within the Industry
Porter (1998 ) argued that the crucial question in determining the firm's profitability is whether it can capture the value it creates for buyers, or whether this value is competed away to others. Who actually captures the value is determined by industry structure ( Porters 5 forces).
Cost advantage and differentiation combined with the scope of activities for which a firm seeks to achieve them lead to three generic strategies for achieving above-average performance in an industry: cost leadership, differentation and focus ( figure )
Porter also argues that a firms profitability is ultimately a function of two basic types of competitive advantage:
a. Low Cost or
b. Differentiation
Lower Cost Differentiation
. Cost Leadership
2. Differentiation
3. Cost focus
4. Focused Differentiation
Broad target
Competitive Scope
Narrow target
Figure 1.3 Generic Strategies
(Source: Porter, M. E. (1998b): Competitive advantage: creating superior performance, New York: Free Press)
The nature of merchandise and services offered, pricing policy,advertising and promotion programmes, approach to store design and visual merchandising and typical location to create an image of the retailer in the customer's mind relative to it's competitors.
e.g.
Cost Leadership
I. no frills product/service
II. Low-cost product design
III. Raw materials cost advantage
IV. Low cost production
V. Reduced overheads
VI. Scale economies
VII. Location cost advantage
VIII. Purchasing inexpensive capital eqiuipment etc.
Differentiation
According to Aakar (1992), in the retail industry, companies can pursue differentiation strategies based on the product i.e.
a) Enhancing performance of the product
b) Improving quality - to be the best
c) Creating prestige
d) Providing service back up
e) Improving convenience of the product
f) Enhancing the reliability of the product
Differentiation according to Aakar (1992) can also be based on:
a) Brand awareness
b) Service features
c) Technical superiority
d) Customer orientation
e) Distribution channels
f) Brand loyalty
Examples:
Focus
Pearce et al. (2000) stated that small companies usually thrieve because they serve narrow market niches. Focusing is usually achieved by selected a specific market segment with a product or service, or by selecting a specific product or service to offer to a specific market.
Example
Companies must choose a position, being all things to everyone is a recipe for strategic mediocrity and below average performance, because it often means that a firm has no competitive advantage at all. Porter (1998) refers to this as being "Stuck in the middle".
example
Types of competition specific to clothing industry
a. Intratype competition - two or more retailers in the same industry compete directly for the same household
b. Intertype competition - two or more retailers not exactly of the same type compete directly by attempting to sell the same product to the same household
c. Divertive competition - when retailers intercept or divert customers from competing retailers, e.g. supermarkets diverting customers from liquor stores. Can be intratype or intertype.
Operations performance Objective
Figure :
Strategic objectives for an operation applied to stakeholder groups
( Source: Slack, N., Stuart, C. Johnston, R.(2001): Operations Management, Third edition, London:Prentice Hall )
Quality:
Speed:
Dependability:
Flexibility:
Cost:
The cost objective is about doing things cheaply by enabling appropriate princing and passing the cost advantage to the customer. Costs are affected by factors such as;
Recruitment, training, technology deployment, size and location of premises, and raw materials or goods.
Prioritising Performance objectives
Measuring Organisation's performance against the Objectives
Fig.3.6 Slack ( Operations management )
Competitive factors
If the customers value this ..
Performance objectives
Then, the operation will need to excel at these ...
Low price
Cost
High quality
Quality
Fast delivery
Speed
Reliable Delivery
Dependability
Innovative products and service
Flexibility ( product/service)
Wide range of products and services
Felxibility ( Mix )
The ability to change the timing or quantity of products and services
Flexibility ( Volume and/or delivery )
Practical Research
Defining objectives of the research
The problem
The hypothesis
The dilimitation
Definition of terms
The assumptions
Reasearch methodology
Data needed
Location of data
Sample questionnaire
Treatment of Data
Primary data
Support data
Findings of research
Summary of Data
Critical analysis of this research and its limitations
Conclusion
Explanatory notes
Scope of the survey
3 The survey of retail clothing trade sales covers a sample of 5 retail outlets. The survey collects
information personal visits by each of the six members to various locations in Gauteng. The pricing was two fold, on the overall pricing of all goods and a more focused look at prcing based on jeans across the different outlets.
This survey includes -
· Edgars
· Truworths;
· PEP;
· Ackermans ; and
· Mr Price.
Classification Data are only collected for those establishments of the enterprise that are
predominately engaged in the retail clothing trade industry.
Survey methodology
and design
4 Designed using Slack operations model , Third edition ( 2003 0, Operations Management, Slack )
different competitive factors imply different performance objectives, Slack p 70 - operations management
The objective of the survey was to access as customers the importance ratings of competitive factors and then to rate the cloting outlets on meeting the performance objectives.
Fig.3.6 Slack ( Operations management )
Competitive factors
If the customers value this ..
Performance objectives
Then, the operation will need to excel at these ...
Low price
Cost
High quality
Quality
Fast delivery
Speed
Reliable Delivery
Dependability
Innovative products and service
Flexibility ( product/service)
Wide range of products and services
Felxibility ( Mix )
The ability to change the timing or quantity of products and services
Flexibility ( Volume and/or delivery )
5 The survey is collected by a questionnaire being filled by each member of the syndicate acting as a customer by personal visits between March and April 2003. The questionnaires are collated and summarized into a single document to be used for making conclusion and positioning.
Sample questionnaire
9. Findings
References
Appendix