While this list is not all-inclusive, it serves to show what miscommunication, lack of knowledge, and unsupportive management can do to a system that works -- if handled improperly. This is why it is so important that the management of Diversified Resources stands behind cost allocations, and explain the true meaning and purposes of allocation.
Managements support and mandate will serve as a means to:
- Remind profit center managers that they share in the profits as well as the costs,
- To encourage use of national accounts and/or centralized services,
- To fix accountability,
- To promote more effective resource management, and
- To foster cost awareness.
Costing Method and Drivers:
For the manufacturing department of Diversified Resources, LTA has concluded to use the activity based cost (ABC) management system because this system more accurately traces indirect costs to activities, identifies activity cost drivers, and allocates costs to orders, products and customers. The following cost drivers were identified:
- Production drivers - the amount of product to be produced
- Duration drivers - the time used to perform an activity
- Intensity drivers - expensive equipment, highly skilled personnel used each time an activity is performed
Further, the activity being performed and referenced above is the production of Pocket Pal, Accurer, and Quik Calc. The primary driver is the production driver because it states how many products are being produced. When the quantity being produced is calculated, costs, inventory, and sales can be monitored accordingly. Assembly and service costs associated with the production process are included in this driver also. The duration driver will monitor the time and costs for a product to go through the process. Lastly, intensity drivers will be applicable to the more complex products, but the equipment costs are applicable to all products. Highly trained personnel and more innovative equipment are required for the complex products, such as Quik Calc, so the intensity driver will separate these costs. In addition, packaging and quality costs are included in the intensity driver. The quality costs include quality control personnel who are trained to detect defective product before it passes to packaging and shipping.
There are several advantages to utilizing the ABC method and the cost drivers listed above. The company’s products have relatively high indirect costs and are diversified, so this method focuses on activity rather than volume, which reduces the risk of misleading allocations. Also, these drivers allowed LTA to see the relation between activities and costs. This is important because management can see what level of production (activity) has the highest costs and can analysis for further improvements. The ABC System easily shows the profitability of each product and this is shown in Table 1.
TABLE 1 ABC System
DIVISION Manufacturing Manufacturing Manufacturing
PRODUCT Pocket Pal Accruer Quik Calc
Revenues $517,500.00 $1,377,000.00 $2,945,000.00
Cost of Goods
Direct Material $30,360.00 $183,600.00 $484,375.00
Direct Labor $124,027.50 $170,595.00 $492,900.00
Direct Overhead $45,043.25 $66,585.67 $202,368.20
TOTAL COST OF GOODS $199,430.75 _ $420,780.67 _ $1,179,643.20
Operating income $318,069.25 $956,219.33 $1,765,356.80
Operating Inc/Rev 61% 69% 60%
The process of allocating the cost drivers is extremely important, because it has a direct relationship to the indirect cost, which in turn correlates to the cost object. This process may be used to determine operating cost among the different products. The objective of this process is ultimately to measure the underlying usage of resources utilized by each individual job. Once the indirect costs are identified, the rate per unit of each cost allocation base can be determined.
The method of cost allocation is another important decision that needed careful analysis. There are many allocation methods available to be used with the manufacturing section, such as single-rate, dual-rate, direct allocation, step-down allocation, or reciprocal allocation. After analysis, LTA concluded the dual-rate cost allocation method would be the most appropriate for this project for a variety of reasons. The dual-rate allocation method signals to division managers how variable costs and fixed behave differently. The fixed costs and variable costs are classified into two sub cost pools and each uses a different cost-allocation base. Further, separately the costs provide important information to guide managers to make decisions that benefit the organization as a whole as well as each division.
Financial Highlights:
The specific budgeted allocation figures for the three products (Pocket Pal, Accurer, and Quik Calc) are detailed in Exhibit 2. The figures were separated into classes – fixed and variable costs.
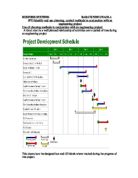
Milestone # 3
Milestone #3 specifically asks the learning team to focus on:
- Identify what happens to the contribution margin and break-even point. Determine if the change is significant
- Calculate the sales necessary to earn a 10 percent return-on-sales.
- Determine which break-even point the division should use
- Select costs drivers to be used for the division’s costs. Compare and contrast the alternatives.
-
Calculate the standard costs for each product in the division
Contribution Margin and Break-even Point:
LTA has recalculated the breakeven point for the manufacturing department of Diversified Resources. The breakeven point is the volume of sales at which there is no profit or loss, however LTA used an approach where we calculated the breakeven to obtain a specific income as a percentage of sales on each product within the division LTA decided that the best possible way to calculate the breakeven was to establish specific cost drivers, as previously stated they are:
- Production Drivers – The amount of units to be produced.
- Duration Drivers – The time used to perform an activity.
- Intensity Drivers – The cost of expensive equipment and skilled personnel used each time an activity is performed.
The benefit of assigning costs based on specific activities is that you are assigning costs based on the factor that causes the activity to occur.
DR’s current and recalculated breakeven analysis is below:
The table shows the effect of using cost drivers that are activity based against those that are volume based. Let’s discuss each products individual result.
Pocket Pal
By breaking out the costs based on activities for the pocket pal we see that the contribution margin drops from 61% to 60% and from $318,069 to $309,600. The breakeven would be higher at $2,075,842 compared to the original amount of $1,825,580. This would indicate to DR that the pocket pal is under cost.
Accruer
Based on the new calculations it would appear that the Accruer is over costed. The contribution margin increases from 69% to 71%, and $956,219 to $972,995 when the costs, are broken down by the new cost drivers. The breakeven amount decreases from $855,182 to $831,534.
Quik Calc
The Quik Calc seems to be under costed similar to the Pocket Pal. We can see that the contribution margin decreases from 60% to 52% and from $1,765,357 to $1,519,063. Again we see that the breakeven has increased from $5,029,318 to $8,082,762.
Why did the change in cost drivers have such an impact on the contribution margin of each item? The simple truth is that the contribution margin is basically the amount of sales dollars that are left after deducting variable costs that cover fixed costs and the desired profit. In this analysis DR wanted to keep their income at the same amount for each product. We have to assume that sales are constant in order to estimate a new breakeven, therefore the only variable was the variable costs. Since they increased in both the Pocket Pal and Quik Calc, the contribution margin for these two products decreased. The opposite is true for the Accruer. The variable costs actually dropped causing the contribution margin to increase.
The purpose of using the new cost drivers was to distinguish problem areas within each product line so that DR can continue to make the profitable. The interesting thing to note from this new calculation is that even though the breakeven amount has increased overall and the contribution margin dollars has decreased overall the contribution margin percentage has actually increased. Let’s now discuss Diversified resources options in achieving a 10% return-on-sales.
Achieving a 10% Return-On-Sales:
The Return on Sales (ROS) ratio usually compares after tax profit to sales. The formula is often calculated by taking net profit and dividing by sales. In this case, LTA will use income divided by break-even calculated sales to arrive at ROS. By using the recalculated figures shown above, then simply changing the desired income to 10%, ROS is achieved. This is depicted in the chart below. Notice that by setting the desired income to 10%, income and BE calculated sales automatically changed for each commodity. The overall averages consistently yielded a 10% ROS.
ROS can help Diversified Resources (DR) determine if they are making enough of a return on their sales effort. For instance, if DR is experiencing a cash flow crunch, it could be because the mark-up is not enough to cover expenses. Return on sales can help point this out, and allow DR to adjust prices for an adequate profit. Also, DR must be sure to look for trends in this figure. If it appears to be dropping over time, it could be a signal that DR will soon be experiencing financial problems.
In order for DR to achieve a 10% ROS, here are likely sales figures needed for each commodity to achieve this goal. Notice that variable costs decrease, while fixed costs remain the same. It only makes since that DR would find ways to decrease variable costs as income decreases from an average of 38% to 10%. The following charts show the breakeven point with a 10% ROS for each product using the current costing system.
Costing Drivers:
LTA developed a working definition of cost driver to state the driver includes an event, task, activity, or volume that drives a corresponding cost. Further, the cost driver of variable costs is the level of activity or volume whose change causes the variable costs to change proportionately (Horngren et al., 2000).
As stated in the previous memo, the manufacturing department of Diversified Resources has concluded to use the activity based cost (ABC) management system because this system more accurately traces indirect costs to activities, identifies activity cost drivers, and allocates costs to orders, products and customers. Identifying activity cost drivers for this project was a discussion that allowed LTA to identify several drivers and compare / contrast the alternatives. LTA identified the following cost drivers:
- Production drivers - the costs associated with production of products
- Labor related cost drivers
- Machine related cost drivers
- Packaging related cost drivers
- Service drivers – costs associated with servicing and supervising process
- Maintenance staff cost drivers
- Supervision cost drivers
- Merchandising drivers – costs associated with transporting product to customer
- Shipping cost drivers
- Customer service cost drivers
- Quality control cost drivers
- Intensity drivers - expensive equipment used in production
Further, the activity being performed and referenced above is the production of Pocket Pal, Accurer, and Quik Calc. The primary driver is the production driver because it states how many products are being produced. When the quantity being produced is calculated, costs, inventory, and sales can be monitored accordingly. Labor, machine, and packaging related cost drivers are more detailed drivers associated with production. The service driver depicts the relationship between number of units produced and the cost of maintenance and supervision required to complete the process. These cost drivers are important because they increase the efficiency of the process.
Further, the merchandising driver includes costs that are associated with transporting products to the customer, such as, shipping, and customer service. These costs are often an after thought, but are important to consider for retention and client growth. The quality costs include quality control personnel who are trained to detect defective product before it passes to packaging and shipping. Lastly, intensity drivers include equipment costs incurred during production. The highly trained personnel and more innovative equipment are required for the complex products, such as Quik Calc, so the intensity driver will separate these costs.
There are several advantages to utilizing the ABC method and the cost drivers listed above. The company’s products have relatively high indirect costs and are diversified, so this method focuses on activity rather than volume, which reduces the risk of misleading allocations. Also, these drivers allowed LTA to see the relation between activities and costs. This is important because management can see what level of production (activity) has the highest costs and can analysis for further improvements
LTA has also taken into consideration the process of allocating the cost drivers. This process is extremely important because it has a direct relationship to the indirect cost, which in turn correlates to the cost object. This process may be used to determine operating cost among the different products. The objective of this process is ultimately to measure the underlying usage of resources utilized by each individual job. Once the indirect costs are identified, the rate per unit of each cost allocation base can be determined. Lastly, there are many additional drivers that could be considered, but after considering all drivers, we concluded the ones listed above were the most crucial to manufacturing. Now that we have discussed the cost drivers let’s take a look at what standard costs LTA derived.
Standard Costs
In order to complete our analysis, standard costs were derived. A standard cost is predetermined, and in this case, is expressed on a per unit basis. As LTA began to calculate the standard cost, the team took into consideration the amount of hours needed to produce one output and the standard cost per hour. The calculations are noted in the table below. Based on this analysis, Pocket Pal and Accruer are much in line with the budgeted cost; however, Quik Calc’s budgeted cost should be reviewed for modification.
Milestone # 4
As LTA moves ahead to milestone 4, the team was tasked with preparing a variance analysis comparing actual to budget, flexed-budget, and an income statement utilizing information previously presented to the BOD (Board of Directors
Income Statement:
Exhihit 2 is the income statement that depicts the actual versus budgeted amounts for the manufacturing department and each product line. The cost allocation methods depicted the areas that required costs to be allocated that the actual income statement did not include. These categories included supervisors’ salaries, rent expense, corporate overhead costs, and depreciation expense; all of which are fixed costs for facility operations. Due to the addition of categories and associated costs, the budgeted income statement’s costs were higher and net income was lower. The net income was lower, even though the budgeted revenue was higher than actual.
The differences in actual and budgeted numbers can be contributed to many factors. Beginning, the costs in the budgeted statement were determined based upon cost drivers and costs associated with all aspects of manufacturing the products. In addition, the prices charged for the products and the expected demand deviated from the budgeted and forecasted amounts. These factors can easily impact the amount of revenue and costs on the income statement.
Revenue and Break-Even Sales Analysis:
After comparing the actual revenue to the break even sales calculation, there are several key issues that should be addressed. Based on the information gathered, Pocket Pal reached 28% of its break even target. This may be due to the fact that fewer goods were sold than expected and for less than what was budgeted. Accruer superceded its break even calculation by 61%. More products were sold relatively close to budget price. Additionally, Quik Calc was close to its break even sales calculation (96%). Although 70,000 less were sold than budgeted, the selling price was very close to the budgeted price.
The company may want to review the selling price of Pocket Pal, because 3,000 fewer goods were sold than budgeted. However, they were sold for $4.50 less than budgeted. In order to meet the break-even sales calculation, one suggestion would be to increase the price of the goods. The item seems to be in high demand and should be able to sustain an increase in price. Before any decision is made, management should review any ramifications of such an action.
Flexed-Budget Variance Analysis:
First, let’s distinguish between a flexible budget and a static budget. A flexible budget is essentially a set of revenue and expense projections at various production or sales volumes. The cost allowances for each expense are able to vary as sales or production varies. A static budget is an itemized of a company's income and expenses expected for some period in the future. It is prepared for only one level of activity and is usually defined as the master budget.
Variances will most likely occur between these two budgets, flexible and static, this can be seen in the information presented to the BOD. Variances can be favorable or unfavorable, depending on what the actual results produce. Variances are generated by the difference between the actual costs and the standard costs for direct material, labor and .
LTA’s initial budget was calculated using estimates of future by examining and analyzing available information based on the current general direction of for prices and/or rates related to the Pocket Pal, Accruer, and Quik Calc. As the change in , , or increased or decreased, the variance proved to be favorable or unfavorable. A favorable variance is shown by an increase in the operating income as compared to the budgeted operating income. An unfavorable variance is shown by a decrease in the operating income as compared to the budgeted operating income.
There are two types of variances calculated in a flex budget; they are the flexible-budget variance and the sales-volume variance. The flexible-budget variance is calculated by computing the difference between the actual results and the flexible budget amount based on the amount of units sold during the specific budget period. The sales-volume variance is calculated by computing the difference between the flexible-budget amount and the static-budget amount. Let’s take a look at the two variances for the products in the manufacturing division of Diversified Resources.
The overall findings of the actual to budget variance analysis is that the Pocket Pal and Accruer have positive results, where as, the Quik Calc had more unfavorable variances. These variances of costs with the Quik Calc indicate a higher production cost. If the same profit margin is kept then the price may need to go up. An in-depth market analysis on pricing/demand tolerance may be a useful follow up for this product. After the added information a decision can be made on a revision in the budgeting of the costs resulting in a higher price or a discontinuation of that line all together. See exhibit 3 for details.
Actual to Budget Variance Analysis:
The variance analysis consisted of an evaluation of the budgetary scenarios for Pocket Pal, Accruer, and the Quik Calc compared to the actual performed based upon the cost drivers we developed earlier, and they are:
- Production Drivers – The amount of units to be produced.
- Duration Drivers – The time used to perform an activity.
- Intensity Drivers – The cost of expensive equipment and skilled personnel used each time an activity is performed.
The analysis also took into consideration the flexible budget results. The flexible budget presents the results of the actual production utilizing the budgeted cost for the product. We will begin the review of the results of the analysis.
Production Drivers
Material used for production of the products was the first production driver reviewed. The Pocket Pal had favorable results in the actual material resulting in a savings compared to the budgeted amount. The Accruer on the other hand had unfavorable results in the actual material usage when compared to budget. When the comparison focused on the flexible budget results only an eleven-cent increase was realized per unit, compared to a thirty-cent increase utilizing only budget. The Quik Calc had a loss with the actual costs, but the flexible budget was lower than the budgeted costs resulting in an overall savings.
Labor hours used to produce the products was the next production driver analyzed. The Pocket Pal actual production hours were favorable when compared to the budgeted hours allotted. The flexible budget however offered a better production cost, resulting in a savings of .96 an hour.
Duration Drivers
Each of the three products has four duration drivers that were reviewed and the results are as follows:
-
The number of units assembled took into consideration the cost per hour to assemble and the actual number of hours. The Pocket Pal and Accruer came in well under budget in the actual results while the Quik Calc did not. The Quik Calc resulted in an extra expense of $52,500 in assembly costs, even though 10,000 more units were produced for sale.
-
The number of hours to produce resulted in unfavorable results for all three products when only the actual performance was reviewed. The flexible budget results mirrored the budgeted expectations for all three products.
-
The quality review duration driver presented overall good results. The Pocket Pal and the Accruer had favorable results when the actual performance was reviewed. The Quik Calc actual results however, were not as positive. The actual hourly rate was fifty-cents higher than the budgeted value causing the actual of both the hourly rate and cost for quality review to be unfavorable. The flexible budget resulted in the same costs as the budgeted figure as the same hourly rate for quality control was used.
-
The packaging of each product was the last duration driver analyzed. The Pocket Pal and the Accruer had favorable results when the actual production results were analyzed. The Quik Calc did not fair as well as the other two products when the actual costs were reviewed. The actual cost results in an extra expense of eight-cents compared to no impact in the flexible budget.
Intensity Driver
The intensity driver for the three products resulted in varying results and they are as follows: The Pocket Pal had an increase in actual costs when compared to budget, but the flexible budget was actually lowered than the budgeted costs. The Accruer had unfavorable results with the actual costs incurred and flexible budget when compared to the budget. The Quik Calc had similar results as the Accruer. The actual costs incurred were higher than the flexible budget, but the flexible budget was higher than the anticipated budget.
The overall findings of the actual to budget variance analysis is that the Pocket Pal and Accruer have positive results, where as, the Quik Calc had more unfavorable variances. These cost variances with the Quik Calc indicates a higher production cost. If the same profit margin is kept then the price may need to go up. An in-depth market analysis on pricing/demand tolerance may be a useful follow up for this product. After the added information a decision can be made on a revision in the budgeting of the costs resulting in a higher price or a discontinuation of that line all together. See exhibit 4 for details.
Recommendations
Pocket Pal
The Pocket Pal is a specialized pocket protector used by the astute accountant. Its design requires talented personnel to handle the basic intricacies of the high-density calculator. This item is very profitable for the company with a 61% return on sales (see Table 1). It is not the highest seller for the company, but represents the lowest in variable and
fixed costs. This product is an asset to DR, because it provides an operating income of a $318,000 gain, versus a loss. Income remains in the "black" despite the different scenarios placed upon the product to test sustainability.
For example, utilizing different break-even sales points for the Pocket Pal yielded a contribution margin of 48% and 60% respectively (see BE analysis). These same two scenarios yielded a steady operating income of 48%. In addition, in comparing actual results to the budgeted results, the Pocket Pal showed favorable variances, which resulted in company savings (see exhibit 3).
These patterns are indicative of a product that is in demand. The Pocket Pal has definite growth potential and can survive an increase in selling price of approximately $4.50 (from $7.50 to $12). The increase in selling price would boost revenues, and ultimately increase the bottom line. It is recommended that strong focus be placed on this item for the future.
Accruer
The Accruer seems to be very profitably for the company. It comprised 28% of the Manufacturing Division's $4,839,500 revenue. The Accruer superceded its’ breakeven goal by 61%. This was mainly due in part to the 102,000 sold compared to the 95,000 budgeted and the selling price. The selling price was fairly close to the budgeted amount. Of the three products, this product is the only one that exceeded its budgeted sales amount. Six thousand more units of the Accruer were sold than budgeted. This seems to suggest that there is a high demand for the product.
Although this products’ percentage of revenue was relatively small compared to the other
products, the sale of the product seems to suggest that it will give the company a steady cash flow. This assumption is based upon the exceeded projected selling amount, and the price for which it was sold. The standard cost of this item compared to the selling price is in good proportion. Twenty five percent of the selling price is standard cost.
The financial outlook for the product appears to be promising. In conclusion, management may want to look at ways to increase consumer awareness about the Accruer. Since there are no cost issues, the increased marketing effort should increase the selling of this product.
Quik Calc
The Quik Calc product line represents 61% of the total revenues earned in the Manufacturing Division. However the Quik Calc’s actual operating income is lower than the budgeted operating income by some $95,374. Why is this happening? There are a couple possibilities. First, the projected number of Quik Calc’s being sold was less than expected. Was the selling price too low? Are too many costs being allocated? These are just a few questions that DR should be asking themselves in order to make the Quik Calc line more profitable.
The biggest problem seems to be in the costing of the Quik Calc product line. Diversified budgeted a total standard unit cost of $2.64, but the actual cost was much higher at $3.81. That is almost a 45% increase in costs over the planned cost. Diversified needs to increase the standard cost, and selling price for this product. Increasing the selling price will help to offset the higher costs of manufacturing the Quik Calc, also by increasing the standard cost; DR will be able to create a more accurate budget that will allow them to focus on other issues such as increasing the number of units being sold. The budgeted number of units to sell was 380,000 however only 310,000 units were sold.
The final recommendation for DR would be to intensify their marketing efforts with regard to the Quik Calc. Once they have their costing issues worked out, they should spend quite a bit of time, and effort on promoting this product since it is their largest seller to date.
References:
Horngren, C.T., Foster, G., and Datar, S.M. (2000). Cost Accounting: A managerial Emphasis. 10th edition. Prentice Hall: Upper Saddle River, NJ.
LTA consists of Beth Baligrosky, Heather Beinlich, Jennifer Boarman, Tina Dunn, Candi Jenkins, and Lisa Ricci.