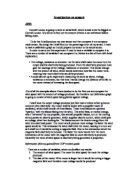
Diagram:
Safety: I shall have to consider safety while doing my experiment and for safety I shall do the following:
- I shall make sure that I shall do my experiment in a side so I don’t get disturbed and also since I shall have the fan open any hazard could occur.
- I shall try to make sure that I don’t over heat the wire
- I shall try to avoid touching the wire when the experiment is going
Preliminary Method: I shall carry out my experiment in the following way:
- First I shall take all the safety into account
- Then I shall get all the apparatus and set it out like in my diagram above
- I shall then start the fan and measure the speed of the wind produced by the fan at the first stage
- After than I shall put forward my motor so it is facing the fan and therefore the motor spinning and producing a voltage
The variable that I shall be changing during the experiment is the speed of the wind, so therefore after stage four I shall return to stage 3 but this time I shall alter the speed of the fan.
Fairness: To obtain accurate results I had to consider how reliable my results would be. Below are a few precautions, which I shall consider while doing my experiment:
- To repeat the experiment twice at least
- To use the same equipment for each experiment, but only change the wind speed.
- I shall always record the upper bounds of the ammeter and voltmeter recordings
- I shall make sure I finish and start my experiment in the same day and same place also with people not opening and closing doors, so that the wind intensity doesn’t change
- I shall clamp the motor so when I change the speed of the fan, that height and distance from the fan of the motor doesn’t change.
While I was doing the practical I faced a problem. The wind from the fan wasn’t strong enough to turn the motor. To overcome this problem I had decided to bend my propellers a bit so that the surface area, on which the wind hits the propeller increases, which could lead to the motor turning. Seen from the rotor blade, the wind will be coming from a much steeper angle (more from the general wind direction in the landscape), as you move towards the root of the blade, and the centre of the rotor. Therefore, the rotor blade has to be twisted, so as to achieve an optimal angle of attack throughout the length of the blade. However even this was unsuccessful. Then the teacher had advised me to use a cork and put my propellers in that and also increase the size of my propellers. I had acted on the teacher’s advice and had made propellers sticking in the cork, and the cork attached to the start of the motor. This had made my motor turn, but not as I was expecting for it to turn on the first stage of the fan (lowest wind speed). Then I had decided to use a ready-made propeller, which was strong. I had attached it then to the motor and testes it and it had worked, as I wanted it to. It had produced enough effect to produce a current and give me a voltage reading. Also there wasn’t enough time for me to repeat the experiment and that is also a disadvantage since I can’t make my results more reliable.
Therefore from the apparatus list above I also used a cork and also an actual propeller.
Method:
- First I shall take all the safety into account
- Then I shall get all the apparatus and set it out like in my diagram above (having the company made propeller attached to the motor)
- I shall then start the fan and measure the speed of the wind produced by the fan at the first stage
- After than I shall put forward my motor so it is facing the fan and therefore the motor spinning and producing a voltage
Results:
I have only conquered three set of results because the variable which I was changing was the wind speed on the fan and I had only three on the fan including the at the start when not running. However as you can see on my graph (next page) I have extended my line according to the best fit a bit. I haven’t increased the line to much due to maybe the graph being a curve further on as the wind speed increases the voltage goes down, so therefore my graph is not that reliable since I have made assumptions. Even though my scientific explanation above proves that as the wind-speed shall increase the voltage is expected to increase I have not assumed that it shall always increase.
Now that I have produced a tested my own made sensor and from it I made a calibration graph, now I can go and test my sensor to the actual company made sensor and find out the percentage error.
Method (This method is how I am going to find out the percentage error):
- I shall take the kit outside, since there shall be natural wind from outside which shall give me a voltage reading.
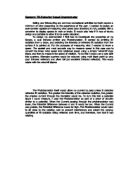
- Once outside I shall set up my kit as shown in the diagram below, and then face the motor towards the prevailing wind and then let the wind turn the motor and give me a voltage reading. At the same time I shall also take the wind speed-reading using the company made wind sensor.
- Once I get a voltage reading I shall then use my calibration graph and then find out what speed the wind was according to my sensor when that specific voltage was produced E.g. Voltage produced: 6V at Wind Speed: 1.6 m/s – But according to my graph when 6V is produced then the wind speed should be 1.3 m/s
- From the results I shall calculate the percentage error of my sensor
E.g. Actual Wind Speed: 1.6m/s My Sensor Wind Speed: 1.3m/s
Percentage Error: 1.6-1.3 = 0.3 ---- (0.3/1.3)*100= 23%
The formula for this is –
( (Actual W.Speed – My wind speed) / My Wind speed ) * 100
At stage 2, I mentioned that I said that I shall compose my motor toward the prevailing wind, but I shall repeat the experiment from stage 2 again at a numerous places and not always facing the prevailing wind. I shall carry out the repetition of stage 2, so I can find out where the wind speed and my percentage error shall be at its minimum and where at its maximum. This shall help me with my aim.
Diagram:
While achieving the results I had conquered quite a few problems. One major problem was that the wind speed had kept on changing and I needed to have the voltage reading and the wind speed reading at the same time, which was not possible. One reason for this was that my response time was not very quick as needed. The wind speed is always fluctuating, and thus the energy content of the wind is always changing.Exactly how large the variation is depends both on the weather and on local surface conditions and obstacles.Energy output from a wind turbine will vary as the wind varies, although the most rapid variations will to some extent be compensated for by the inertia of the wind turbine rotor. Below is a graph showing how quickly wind speed actually varies:
Picture gained from www.windpower.org
Due to this my results are not that reliable and the percentage error would also be not that accurate. Also at times there is no wind at all or very little, which doesn’t get perceived by the motor to give me a voltage reading. Another reason why my results could have been have unreliable due to the resolution of the Volt Meter and the Wind sensor not being very good. Also the Volt Meter was to only 3 significant figures whereas the Wind speed sensor was to two significant figures. This also makes my results less reliable since the results are rounded up and then my percentage error has also been rounded up to two significant figures. Due to me carrying forward the rounding up errors, my percentage error could vary from plus or minus 3 from the result given. The actual wind sensor had mentioned that it would give me results within in the range of plus or minus three, which could have caused a systematic error for me throughout the whole experiment. Another systematic error was the internal resistance in the motor, which I couldn’t do anything about. The motor, like any other appliances also consists of an internal resistance, which therefore is a hundred percent efficient and producing sufficient amount of voltage.
Due to all these difficulty I have taken the average of my percentage error of my sensor, which is likely to improve my final result.
Results:
As you can see from my results that the percentage error of my sensor is quite high, showing that my sensor was not that accurate. However as I have mentioned before due to experimental errors my results are not that accurate, therefore I have taken the average percentage error, which shows that overall my sensor was quite accurate. There is a trend in my results of the actual wind speed being more than my sensors wind speed. However there is one anomaly when I had tested the motor outside facing the prevailing wind. The actual wind speed was less than my sensors wind speed when producing the same voltage, giving me a negative percentage error. I believe the reason for this is due to my response time. As I have stated before that the natural wind speed fluctuates very quickly, which means the voltage also changes according to the wind speed. I believe the anomaly result must have come into place by me getting a wind speed and voltage reading at different time.
Overall I am happy with my sensor, since it gave me the results I had expected and the margin of difference wasn’t really large.
There are a number of ways how I could have improved the experiment:
- To repeat it three times and get the average results from them all
- To have a partner working with me so I could get him to watch the voltage reading as I get the wind speed reading
- To have more wind speed and voltage reading for my calibration graph, so I could actually prove that it is a strong positive correlation graph
Conclusion:
From the average percentage error I believe that my made sensor could be used to decide on how much wind the aerial can withstand before falling down. Also from my results I have come to quite a few conclusions on where the aerial should be placed:
- It should not be placed high above ground. High above ground level, at a height of about 1 kilometre, the wind is hardly influenced by the surface of the earth at all. In the lower layers of the atmosphere, however, the friction against the surface of the earth affects wind speeds. Also by fitting the aerial to the bottom maximises the disturbances of airflows from the mast itself.
- The aerial should not be placed between buildings. As you can see from my results that between buildings has one of the highest wind speed due to the air becoming compressed, on the windy side of the buildings, and its speed increases considerably between the obstacles to the wind. This is known as a "tunnel effect”.
- It should be placed around Obstacles to the wind such as buildings, trees, rock formations etc. can decrease wind speeds significantly, and they often create turbulence in their neighbourhood.
As you can see from this drawing of typical wind flows around an obstacle, the turbulent zone may extend to some three times the height of the obstacle. The turbulence is more pronounced behind the obstacle than in front of it.
- It would be a good idea to have the aerial surrounded by trees since a tree with leaves will brake the wind. It has a very low porosity.
Bibliography
Books:
- ADVANCING PHYSICS, AS – BY JON OGBORN AND MARY WHITEHOUSE:
From this book I gained some background knowledge on sensors, and how they work. Also I learned what errors could turn up while using sensors and how to make them more efficient. This book was very useful to me since it had enhanced my knowledge on the experiment. Also I believe that the sources from this book are quite reliable due to it being used by many people and it belongs to a very well known organization
- CGP PHYSICS REVISION GUIDE –BY RICHARD PARSONS:
From this book I gained information on motors and how they work. This book was quite useful to me and reliable, however it contained basic knowledge on motors in it.
- ORDINARY LEVEL PHYSICS –BY A.F. ABOTT
This book gave me quite a bit of information on internal resistance and how it could affect your results.
Web-Sites:
-
WWW.WINDPOWER.ORG: This site has helped me determine that attaining accurate results isn’t really possible due to the quick changes in the wind speed each second. Also from this site I learned how obstacles positions could determine the amount of wind speed. Additionally I believe this site is reliable since it’s got an original name and is related very much to my sensor.
-
WWW.WINDINDUSTRY.ORG: This site had enhanced my knowledge on where industries usually place their wind turbines. However the circumstances, in which wind turbines should be placed is likely to favour the wind, but the aerial I am going to place is to have the least amount of wind. So therefore this site was not that useful, but if I took the opposite conditions to the ones provided by the site, then those circumstances could be useful to place an aerial in.
-
WWW.EERE.ENERGY.GOV: From this site I had learned how the wind actually produced electricity. I believe that this site isn’t that reliable compare to the others, but is not totally unreliable.
I had no real problem with my coursework research, but at times I had received information relating to the same aspect but saying different things. I have always considered more than one appliance before making a point due to this making my research more reliable.
When on the sites I had looked up on the conditions, which increase wind speed, and reduce wind speed, they used to be different. In these circumstances I have used the information from the site, which I believe is more reliable. I had also considered if the information was updated, or very old, but that doesn’t really affect my investigation.
UMAR KHAN