Measure out 50ml of hydrogen peroxide and pour into a conical flask.
Fill a plastic tub, ½ full of water.
Fill a measuring cylinder to the brim with water. Cover the end of the measuring cylinder making sure no water escapes. Tip the measuring cylinder upside down and place it into the plastic tub of water.
Take the rubber bung and tubing. Put the tubing so that the end is inside the measuring cylinder in the water.
Put 10 pieces of potato in the hydrogen peroxide.
Place the rubber bung in the conical flask as soon as possible. Start the stopwatch at the same time.
The oxygen produced by the potatoes and the hydrogen peroxide should travel down the tubing into the measuring cylinder.
Using the scale on the measuring cylinder, it is possible to see how much oxygen is being produced.
Take a reading every minute.
Repeat the experiment but with different volumes of hydrogen peroxide.
50ml H O (hydrogen peroxide)
40ml H O + 10ml H O –(water)
30ml H O + 20ml H O
20ml H O + 30ml H O
10ml H O + 40ml H O
0ml H O + 50ml H O
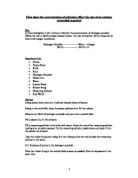
Diagram
Fair Test
In order for the experiment to be fair, I will need to keep some of the factors constant:
- The amount and size of potato used.
- The size of the conical flask.
- The amount of time the experiment will be carried out for.
Prediction
The experiment will show us if the concentration of hydrogen peroxide affects the rate at which it is broken down and oxygen and water are produced. I think the reaction will take place quicker if the concentration of hydrogen peroxide is higher.
Results
Graph
A graph to show that the concentration of H O affects the speed of it’s reaction with catalyse to make oxygen and water
A graph to show the relationship between the amount of gas collected after a specific time and concentrations
Analysis
Graph A shows the results of all the experiments. We can clearly see that the line on the graph is steeper when the concentration of the hydrogen peroxide in the solution is higher. If the line of the graph is steep, it means that the reaction happened quickly. Whereas if the line was gentle, the reaction would have happened slowly. It is clear from the graph that the higher the concentration of H O , the quicker the reaction takes place.
Graph B shows again whether the concentration of H O affects the speed of a reaction. The points plotted on graph B are the final result of each experiment i.e- how much oxygen was collected after 10 minutes. The horizontal scale is the different concentrations of H O and water in the solution.
Evaluation
There was a lot of measuring involved in the experiment, which could have led to a lot of mistakes.
Although my results weren’t completely accurate, they still support my original prediction.