Factors can also be physical things like:
- Rivers
- Hills
- Motorways
- Valleys
I believe that Huntingdon follows Burgees’ concentric ring model (1920).
The characteristics of Burgees’ model are the following:
1. The CBD is located at the centre.
2. The oldest area is at the centre.
3. Population density peaks in the CBD.
4. The lowest residential density is in the CBD.
This is why the buildings will be oldest, the pop. Density will be higher and the quality of the environment will be best in the centre of the CBD.
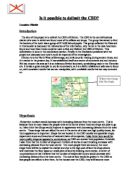
I decided to collect data at the six sites shown on the map overleaf. I chose these because I thought that they had more of the characteristics of a CBD than any other places in the town.
Primary Data
1) Pedestrian Flow
I counted the number of people passing each site for 5 minutes and didn’t vary the time, as it is important to keep this the same so that it is a fair test. I used this method because there was no other accurate method of finding this out. I needed to conduct this survey because the higher the pedestrian flow is in a place the more national shops would be in the area therefore the higher the land rent and this means that the area is more likely to be the centre. I also took photographs which I annotated showing the areas clearly.
- Environmental Quality
I recorded the quality of the environment in an EQA. I gave options of the different environmental issues and a scale of 1 to 5, 1 being poor and 5 being excellent, then, the higher the amount the better the area.
2.1 An example of the EQA I used
I used this method because it was a very efficient and easy to use way of measuring environmental quality. I needed to conduct this survey as the better the area the better looked after it must be and therefore is more likely to be the centre.
- Survey
I asked around 20 people at each of the sites the questions I had designed for the questionnaire and gave them the options of my six sites. I asked people of all ages so that I had a fair opinion.
The three questions I asked were:
- Where do you think the centre of Huntingdon is?
- Where do you think the busiest place in Huntingdon is?
- Where do you think the cleanest place in Huntingdon is?
I collected the results in a table and used different colours for age groups, I asked them to choose from a list of the six sites I am investigating. I used this method as it was the only way of finding out people’s opinions and using this way meant that I could find out the opinions of people who know the Huntingdon area well. I did this survey as it is important to take peoples opinions into account.
- Building Ages
I found out different building’s ages by identifying the architectural styles at each of the six sites. I used this method as it was the simplest way. I could have used dates set into buildings but this wouldn’t have been very useful as only a few have this on them. I needed to conduct this survey because towns and cities grow from the centre so the buildings in the centre would be the oldest in town.
5) Land Use
I worked out land use by identifying whether the building was a house, factory or shop, if it was a shop I specified what kind. I used this method because it was simple to do. I needed to do this survey because if land use is a shop it is likely to be in the CBD and if it is further out it could be industrial or accommodation according to the Bid Rent theory.
I did this over the whole town centre and marked the results onto a map, if there were any derelict properties I marked this with a D.
Secondary Data
1) Land Rent
I found out the land rent for the different sites from the internet at . I collected this data because the Bid Rent Theory suggests that the most expensive area is the centre therefore the most expensive site should be the centre.
2) Shop information
I found out what different kinds of shops there are in Huntingdon, this was on a sheet given to me. I used this data because it gave me insight into what kinds of shops there are in Huntingdon.
Problems and Limitations
Some of my data has limitations. The questionnaire could be limited as I did it on a Wednesday and this means that most of the public in town will have been pensioners and the unemployed therefore I wasn’t able to find out the opinions of the employed. The EQA might not be accurate because of the time of the day or day of the week and because it is subjective of my opinion .i.e. I might have been biased without meaning to when judging an area. For example Market Square might have been dirtier than usual as it was market day, or each site may have been cleaner than usual as it was the beginning of the day. The pedestrian flow might also be inaccurate as it was a weekday therefore there would have been less people there than there would be at weekends, we couldn’t do all of them at exactly the same time and the market might have meant that the pedestrian flow for Market Square was unusually high.
The collection of data was made difficult by the rain as it smudged some of the results. Doing the questionnaires was also difficult, as people didn’t want to answer our questions, perhaps because of the rain, so to overcome this we had to keep asking until enough people had agreed. I tried to ask men and women of all ages but this was difficult as most middle aged people were working so a lot of my results were from pensioners.
Summary tables of my data and my original data are on the following pages:
On the following pages my results are displayed.
Justification of methods
I chose to display my results on maps because the location of each site is shown, the data for all of the sites can be viewed at the same time and therefore it is very easy to compare.
I chose to show population flow on flow lines because the proportions are very easy to understand and you can easily tell the highest and lowest population flows.
I showed the environmental quality on star graphs because the size and shape of the coloured areas allow a quick visual comparison.
I used bar charts to show the survey results because they are very clear and the biggest groups are easy to spot, I showed the busiest areas on pie charts because the biggest groups are then easy to pick out
I decided to use annotated photographs to show land use because this allows me to have evidence of what I am talking about.
Annotated Photograph of St. Benedicts Court
Land Use
- Mainly commercial land use
- No non-national shops
- No houses or flats
- Buildings are all terraced, very close together and the street is very narrow
- Modern buildings
Annotated Photograph of the High Street
Land Use
- Mostly commercial land use
- No non-national shops
- Possibility of flats above shops
- All terraced buildings
- Reasonably wide street
- Old buildings but not the oldest in town
Annotated Photograph of Chequer’s Court
Land Use
- Mainly commercial land use
- 2 non-national shops
- Flats above shops
- Terraced buildings
- Narrow street
- Modern buildings
Annotated Photograph of Germain Walk
Land Use
- All commercial land use
- No non-national shops
- No flats/houses
- Terraced buildings
- Wide street
- Modern buildings
Annotated Photograph of St. Mary’s
Land Use
- Mostly commercial land use
- A number of non-national shops
- A number of flats and houses
- Terraced buildings
- Wide street
- Quite old buildings
Annotated Photograph of Market Square
Land Use
- All commercial land use
- Some non-national buildings, i.e. pub
- No flats/houses
- Terraced buildings
- Narrow street
- Some modern buildings but also Georgian which is the oldest in town
Questionnaires
My questionnaire shows that the public think that the centre of Huntingdon is Market Square. They thought that the busiest part was the high street so these results contradict each other as the theory suggests that the busiest part of a town is likely to be the CBD. They also thought that St. Mary’s forecourt was the cleanest area but I think that this is because the pedestrian flow here is the lowest therefore less mess can be created, this was proved correct by the pedestrian count.
Another point is that towns often grow from the centre and especially in the countryside they often grow from a market area as the local farmers would sell their produce there. The land cost was highest at market Square. These are another two factors pointing towards Market Square as the centre.
From my questionnaire results I can conclude that the centre of Huntingdon’s CBD is Market Square.
EQA’s
The geographical theory suggests that the area with the best environmental quality would be the centre of the CBD as the most money would be put towards its upkeep but the theory also says that it could be the worst area as there are the most people there to mess it up. This links in with the questionnaire results at St. Mary’s. The 2 sites with the joint best EQA were St. Mary’s and St. Benedicts whilst Chequer’s Court had the worst. I don’t think that St. Mary’s could be the CBD as this was the quietest site and the pedestrian flow at St. benedicts was comparatively lower than it was at other sites so I don’t believe that this is the centre either. Chequer’s Court did have a high pedestrian count but the buildings were built at 1950-1990 and as towns grow from the centre I don’t think that this can be the centre. From my EQA results I can conclude that the centre of Huntingdon’s CBD is Chequer’s Court although I am fairly sure that this is not true as the buildings are modern.
Building Age
Theory suggests that the CBD will have the oldest buildings as towns generally grow out from the centre. If this is correct it would mean that Market Square is the oldest as it has some Georgian buildings and the church there is very old, possibly medieval therefore this is the oldest building in town and as religion used to be much more important than it is now the church would have been in the centre of town. Although, there is a very old church at St. Mary’s this cannot be the center as there are so many other things counting against it. From my building age survey I can conclude that the centre of Huntingdon’s CBD is Market Square.
Pedestrian Flow
Pedestrian flow would be the highest in the centre of the CBD and as the site with the highest pedestrian flow was the high street this could be the centre. The high street had a flow of 124; the next two highest counts were Chequer's Court and Market Square, Chequer's Court with 100 and Market Square with 91. As it was market day in Huntingdon when I collected my data this may have affected the average flow for this site so this number could have been higher or lower on an ordinary day. From my pedestrian flow results I can conclude that the centre of Huntingdon’s CBD is the High Street.
Land Use
The land use of an area is a very important factor to take into account. I think that the land use evidence points to Market Square because this area is all commercial land use, there are no houses or flats, the buildings are terraced, the street is narrow and many of the buildings are Georgian and the church is medieval. St. Benedicts has most of these characteristics except for the building age as the buildings here were built in the 1960’s therefore this probably is not the centre. The High Street has a wide street and buildings from the 1950’s so this is counting against this being the centre. Chequer's Court probably isn’t the centre as it has a narrow street, non-national shops and has flats above the shops. The buildings in Germain walk were built in the 1990’s so are very modern. I don’t think that the centre can be St. Mary’s as there are many non-national shops here and there are a number of flats and houses. From my land use survey I can conclude that the centre of Huntingdon’s CBD is Market Square.
If for my questionnaire I had asked a different set of people I could have had completely different results therefore this could not be highly reliable. To take this study further I would collect more results in the afternoon of a weekday or a morning of a weekday that wasn’t market day or a weekend, I would also collect data at a weekend, and then I would see if the different results were varied and take averages. I would take more data for everything; not only the questionnaires and I would compare all the data.
Overall Conclusion
Based on my data I believe that the centre of Huntingdon is Market Square.
My results support my expectations as I thought that Market Square would be the centre. There area number of points showing that Market Square is the centre:
- The public said that they thought that this was the centre of Huntingdon.
- Geographical theory states that towns grow out from the centre and therefore the building sin the centre would be the oldest in town, Market Square does have the oldest buildings in Huntingdon.
- The land rent was highest at Market square.
- The centre of a town is often a market place as local farmers used to bring their produce to town to sell, this is especially true in rural areas, and Market Square is a market place.
- Market Square was in the top three highest pedestrian counts.
- The land use was typical of a centre.
My results supported my expectations as I though that the centre would be Market Square although not all of my evidence pointed towards this which surprised me. There are links between some of my results, for example the EQA and the pedestrian flow, the EQA was generally better the lower the pedestrian flow and I think this was because there were less people in that area to lower the quality of the environment.
Summary Table
The map below shows the location of Huntingdon’s CBD, the red circle shows the CBD whilst the smaller blue circles show the other five sites.
Evaluations
If I were to do this again I would collect more data so I could come to a more accurate result, I would collect more data on many things, for example building density, I did about this in my EQA but I would go into it in more detail as the closer together buildings are the more likely that it is the centre because they try to fit as many shops into the centre as possible.
I was able to draw valid conclusions from my data although the more data you collect the more reliable your results are, so you can never collect enough. I was able to present my results well, but I collected only one set on a Wednesday morning. I should have collected data on at least one more occasion to make sure that I didn’t have anomalous results. I perhaps should have collected again on a weekday afternoon or a weekend. Also, it was market day on the day I went which may have affected my results all over town but especially at Market Square. The time of day could also affect my results; local companies could have been on their tea break so my pedestrian count could have been affected.
If I did this study again I would concentrate more on land use to come to better conclusions about this.
When collecting the data a problem I faced was the weather, it was raining and therefore was difficult to write down results. The weather also made it hard to give people the questionnaire as they didn’t want to stop in the rain, to solve this I just had to persist until I had enough data.
I presented all of my data fully and it is very clear to see which sites were more likely to be the centre from this. I think it was a good idea to display my results on maps with overlays as this allows all the results to be viewed at once and therefore easily compared.
Using flow lines to show pedestrian flow was good because the proportions are easy to understand and it makes it very easy to see the bigger and smaller groups.
Showing the EQA’s on star graphs allowed a quick visual comparison so I think that this was done nicely.
Using pie charts to show survey results was good because the biggest groups were easy to pick out from these.
Using annotated photographs gave me evidence to show what I was talking about although I’m not sure that it was the best way to show land use as using them to compare was quite difficult, I think that pie charts could have been more effective because then proportions for different groups and sites could then have been seen easily.
I believe that my results are accurate as they gave me the results that I expected. People’s answers to the questionnaire could affect the accuracy as I may be asking someone who doesn’t have much of an idea of what I am asking them. Some of my results did surprise me, I thought that the population flow at Market Square would have been higher and I expected that buildings at some of the sites built around the 1950’s to be older than they were.
I did get some anomalous results, e.g., the people asked in the high street thought that Chequer's Court was a very clean area whilst everyone else said that this was one of the dirtier places. Also, people asked at Chequer’s Court thought that Market Square was the busiest place in town whilst people everywhere else thought that this was one of the less busy places.
St. Mary’s having the best EQA contradicted my expectations but I believe this is because there are far less people there to make a mess as it is a less populated area.
My conclusions have fulfilled my aim which was to find the centre of Huntingdon’s CBD, my conclusion states that the centre is Market Square.
My conclusions could be wrong as not all of my results pointed towards Market Square, but this was the site with the most factors. Also, my results may be wrong for some reason, for example, my questionnaire results could be wrong as people in town may have answered incorrectly. I would extend this work by collecting more data at different times of the week and looking for variations in the results, I would also work on averages for these results.