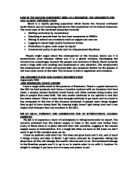
SITE C
Site C was the Roundabout Car Park. This was the site from which I expected to get the most people. It is an easily accessible car park - the roundabout beside it has routes to Chobham, Sunningdale, Virginia Water, Windlesham and Chertsey. It is a large car park with a capacity of approximately 100 cars. There is a small picnic area beside it, and in summer there is usually an ice cream van parked in the car park, making it appealing to families, especially those with young children. This area is obviously public-oriented, and according to the Surrey County Council Management Plan it is in fact the most popular car park on the Common.
Data Collection
Primary Data
The first method of data collection I used was a questionnaire. I chose to use this to find out about general public land use of the Common, the sphere of influence and the activities for which the Common was used. I felt that the simplest and most useful way of doing this was to ask the public themselves.
I went to the Common on three different days to each of three different sites; a bank holiday, a weekday, and a weekend. This way I felt I would catch the widest possible range of people using the Common - workers, old people, families, etc. I stayed at each site for three hours, and then went on to the next. This could have caused a problem, since if I was at Site A on a bank holiday morning, I would not be able to question the people who were there on the bank holiday afternoon. However, the only way I could have avoided this problem was to go to every site on weekends, weekdays and bank holidays and spend the whole day there, or enlist the help of other students or family. However, I felt that doing this would be too risky. With most of my questions there was particular kind of answer I was looking for, and even if I had briefed my helpers on what I needed, there would still be the risk that they accepted an unsatisfactory answer.
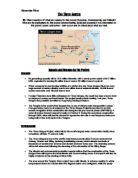
I chose three different sites on different areas of the Common to get an overview of the entire area. I used a junction of 2 paths away from any car parks (Site A), a small flat area beside the Queen Elizabeth Monument (Site B), and the largest car park (Site C). These were very different sites, so they gave me a good range of visitors.
I ran a pilot questionnaire on the Chobham Common Ranger to check that the questions were valid and easily understood. I only had to make one adjustment, which was to the first question (see copy of questionnaire on page.....)
Since my questionnaire sites were not permanently busy, the way a street or shopping centre might be, I asked everyone who went past rather than deciding, for example, to ask every fifth person.
I also studied a section of a pathway to see how public impact decreased/increased with distance from a car park.
I chose a 600m section of pathway leading from the car park at Site C to the junction at Site A. I chose this pathway as I knew a large number of people would use it, since Site C is the biggest car park on the Common. I broke it down into 100m sections, and then walked along it, looking for signs of litter, dog fouling and footpath erosion. I recorded my findings on a quick sketch drawing of the pathway, using a different symbol for each of the three things I was looking for.
Secondary Data
My secondary data was mainly information about the geographical and biological background of the Common.
Interviews with : Surrey County Council
Surrey Heath Wildlife Trust Management Programme Officer
Chobham Common Ranger (Andy Wragg)
Camberley Fire Brigade
Surrey Ornithological Society
Literature : Surrey County Council Chobham Common Management Plan (Year 2000-2003)
Maps from Surrey Heath Wildlife Trust
Chobham Common Questionnaire
I’m studying Chobham Common for my Geography GCSE coursework. Would you mind answering a few short questions please?
1. How many people are usually in your party when you visit Chobham Common?
1 [ ] 2 [ ] 3 [ ] 4 [ ] 5 [ ] 6 [ ] 7+ [ ]
2. What age groups do the people in your group fit into?
<10 [ ] 10-20 [ ] 21-30 [ ] 31-40 [ ] 41-50 [ ] 51-60 [ ] 61-70 [ ] 70+ [ ]
3. What area are you from?
Chobham [ ] Sunningdale [ ] Ascot [ ] Sunninghill [ ] Bagshot [ ] Knaphill [ ]
Windlesham [ ] Other [ ] ..................................
4. How do you get to Chobham Common?
Walk [ ] Car/m’bike [ ] Cycle [ ] Horse ride [ ] Other [ ] ...............................
5. How often do you usually visit Chobham Common?
Daily [ ] Weekly [ ] Monthly [ ] Rarely [ ] 1st time [ ]
6. What day do you usually come to the Common on?
Monday [ ] Tuesday [ ] Wednesday [ ] Thursday [ ] Friday [ ] Saturday [ ]
Sunday [ ]
7. What time do you usually come to the Common at?
6am-9am [ ] 9am-12pm [ ] 12pm-3pm [ ] 3pm-6pm [ ] 6pm-9pm [ ] 9pm+ [ ]
8. How long do you usually stay for?
<1 hour [ ] 1-2 hours [ ] 2-3 hours [ ] 3-4 hours [ ] 4-5 hours [ ] 5 hours + [ ]
9. What do you usually use the Common for?
Jogging [ ] Dog-walking [ ] Cycling [ ] Walking [ ] Bird-watching [ ]
Horse-riding [ ] Other [ ] .................................................
10. Do you tend to stay on the paths or go across the heather/grass?
Paths [ ] Grass [ ] Both [ ]
11. Do you ever find your activity conflicts with others? (dog-walking + bird watching?)
Yes [ ] Sometimes [ ] No [ ]
....................................................................................................................
12. What do you think of the public facilities here? (bins, toilets)
Very poor [ ] Poor [ ] Satisfactory [ ] Good [ ] Very good [ ]
13. Is there any sort of weather that would stop you from visiting the Common?
Too hot [ ] Too cold [ ] Windy [ ] Wet [ ] No difference [ ]
Thank you for your patience and co-operation
Results
Looking at the results obtained in my questionnaire, I can make many observations.
Group Size
In Group Size, by finding the mean of the three sites, the average number of people per group is 2.25. There is a small difference between Site A and Site C, whose average group sizes come to 2.05 and 2.5 respectively.
The average number of people in a group visiting the Common is 2/3. This means that more of the footpath being used is likely to be eroded than if most people came alone, since people tend to walk side by side along a path rather than in single file.
Age Range
It is quite easy to see from the graph that in all three sites the most frequent age range of visitors to the Common was 31-40yrs, with 41-50yrs close behind.
In Site A the most common age range was quite obviously 31-40yrs, as it was also with Site C. At Site B, the most common age range was 41-50yrs. However, there was still a high frequency of people in the 31-40yr age range. Therefore, the most common age range of visitors to the common at all three sites was 31-50yrs.
Sphere of influence
There was a wide spread of visitors from all the surrounding towns and villages, as well as some from further away. Overall, 16% of the visitors to the Common came from Chobham, and 14% from Ascot, making these the areas on the questionnaire that most visitors came from. However, 23% of the visitors I questioned ticked the ‘other’ box on the questionnaire, with their areas ranging from the nearby town of Woking to Ireland.
Means of access
the Common would not have been a problem. I was interested to see that 21% of all visitors to Site B rode to the Common, while of all visitors to Site A, only 5% came by horse.
The Common is bisected by the M3 motorway, and therefore already is continually affected by fumes given off by cars. With 74% of all visitors coming to the Common by car, the amount of chemicals and gases is increased. High levels of nitrogen deposits have been found within 200m on either side of the M3, and it is safe to assume that with large numbers of cars coming and going to and from the Common that these deposits will be found on plants around the car parks. However, it is unlikely that the Common is affected as much as a site away from any background pollution (such as the M3) would be. Another issue raised by ‘means of access’ is, again, footpath erosion. 12% of visitors come to the Common on horseback and 13% on a bicycle. All these visitors will obviously cycle and horse ride during their visit to the Common. These two activities erode the footpaths very fast, and people riding horses and bikes usually travel further around the Common as they move faster than people walking. This means that combined, 25% (a quarter) of all visitors heavily erode footpaths during their visits.
40% of visitors to the Common came at least once a week (see graph above), while 28% visited at least once daily. At Site A, double the amount of visitors coming daily came weekly, while at Site B, the same number of people came into both categories.
The results of the question about ‘day of visit’ are most easily seen on the graph below. There is an obvious increase of visitors coming toward the end of the week, changing from 11 people visiting on Mondays to 19 on Saturdays, and 18 on Sundays.
All three sites generally follow the same trend, with the only differences found midweek around Wednesday and Thursday.
Over a quarter of visitors go to the Common every day, and almost half visit at least once a week. This means (for those who visit daily), whatever impact a single visitor has on the Common is multiplied by 7 every week.
The most popular time of visit was between 3pm and 6pm, with 31% of visitors coming to the Common in this time slot. However, with 28% visiting between 12pm and 3pm, the results show that most visitors come to the Common in the afternoon.
Most visitors to the Common spend 1-2 hours there, with 40% of visitors fitting into this slot. 30% spend less than an hour, and 25% are at the Common for 2-3 hours. After this, only 5% of all visitors stay longer, with 4 hours the longest amount of time spent on the Common.
Dog walking is the most popular activity on the Common, with 46% of all visitors coming to the Common to do this. Walking is the next most popular activity, with 16% walking on the Common. Site B seems to have the most variation of activities, while at Site A, most people walk their dogs and very few do anything else
Surprisingly, most visitors to the Common come whatever the weather. 34% of all visitors visit under any weather condition. However, 33% said they would not come to the Common if it was raining, and 17% would not visit if the weather was windy.
With 34% of visitors going to the Common whatever the weather, footpath erosion is worsened. After rain or snow, the ground is wet and soft and more easily eroded. Puddles are also left, so people walk on the edges of the pathways to avoid them, usually trampling the plants growing on either side.
. Since almost half of the visitors walk their dogs on the Common, that means almost half of all visitors to the Common bring at least one dog with them. When 28% of visitors come daily and 40% at least once a week, the amount of dog fouling is considerable.
Only 18% of visitors find their activity occasionally conflicts with others, leaving 33% of all visitors untroubled by conflicts.
Few people find that their activity often conflicts with others on the common, with only 8% ticking this box on the questionnaire.
The majority of visitors (26%) stay on the paths, while only 9% avoid the paths and walk on the grass and through the heather. The remaining 25% use both the paths and the grass. While the 43% of visitors staying on the paths are eroding them quickly, the remaining 57% are also trampling over the plants and grasses. These plants may be delicate and rare, and people walking over them could easily damage them. The plants are also habitats for a huge variety of animals. People trampling the plants can scare and injure the animals living in them and fragment the site as a habitat.
My investigation into public impact v distance from car park produced the following results:
I noticed that most signs of public damage were in Section 1 (the section closest to the car park), and the least in Section 5. The most signs of litter found were in Section 1. I found the most signs of dog fouling in Section 1 also, and the most signs of footpath erosion were in Sections 1 and 5. While the distribution of the first two categories was fairly random, I found that amounts of footpath erosion was almost constant throughout. If the soil and vegetation had been varied along the transect, it might have affected the result, but as far as I could tell it remained constant.
Section 1 is closest to the car park, and this is where practically everyone will go, whether they walk a long way or just stay a few minutes. This means Section 1 will get the most impact as there are more people using it. Using this theory however, would mean that Section 6 would show the fewest signs of public impact. However, Section 6 of this pathway is close to Site A, a junction between two paths. Has Section 6 been a normal part of the pathway, it is likely it would have fit the theory. However with a junction next to it, it is receiving double the amount of public impact it would otherwise; people for both the pathways. Looking at the rest of the pathway, it is quite obvious that public impact decreases with distance from the car park.
Interview Results
From my interview with Andy Wragg, the Chobham Common ranger, I found that there are three main problems presented to the Common by the public - litter, footpath erosion and dog fouling.
Litter causes a lot of trouble to the animals living on the Common. The ranger said that: ‘animals are cut on cans or plastic bottles and suffocate in plastic bags. If litter is dropped close to a habitat in which there is a delicate balance of fauna, there is a danger that deaths caused by litter upset the entire food chain and important or rare species are lost.’
The ranger said that Chobham Common’s flora is also damaged by litter - chemicals in rubbish dropped onto plants upset the soil’s nutrient balances and damage the ecosystem. Due to the Common management’s limited budget, there is only one ranger, who does all the litter picking himself. The cost of litter picking is £30 per hour, as well as the cost of equipment. He spends on average one hour a day, 5 days a week, litter picking over the whole Common. Per year, this adds up to a total of £7350.
Footpath erosion not only means the Common’s management has to spend money resurfacing them, but plants on either side of paths are easily damaged; when there has been heavy rain, puddles form in footpaths and people tend to trample across the plants on either side of them to avoid getting wet. Mountain bikes are the biggest problem as furrows are created in paths and once rainwater gets into them, the footpaths are easily eroded. The ranger said ‘After a public enquiry in 1999 to find out the most used paths and desired routes, a new network of paths was set up to fit the routes the public wanted. This meant that fewer visitors trampled over the heather and delicate sections of the Common to get to the areas they wanted to visit. Car parks were also positioned to guide visitors away from delicate areas.’ Other than occasional re-seeding to replenish trampled ground, very little action is now necessary to combat footpath erosion.
Dog fouling, while unpleasant for visitors and dangerous for families with young children, also has an effect on the habitats on the Common. In areas where dog fouling is frequent, the soil pH and nutrients are changed, affecting plant life. The ranger said that an excellent example of this is the path leading from the car park at Site C up to Site A. The plant life here is totally different to that of the rest of the Common. This is almost purely caused by dog fouling. Little can be done to reduce dog fouling on the Common at the moment, as the Common management cannot afford to put in dog bins. Dog bins cost £2 to empty per day, and 20 would be needed across the Common. Added up over a year, the annual cost of dog bins alone would be £14400.
Another problem for the Chobham Common management are the property owners. There are several private properties on the Common, and occasionally people living on the Common object to maintenance work carried out near their homes for various reasons. This hinders the Common’s upkeep, and according to the ranger, many rare species have been lost because people living on the Common refused to allow him to maintain them.
Another problem caused by public access to the Common that I found out about was arson.
The Chief Fire Marshall at Camberley Fire Station said that while most people in the Chobham Common area are aware of the many fires across the Common, few realise the majority of these fires are started deliberately or accidentally by visitors. According to the Camberley Fire Station, there are on average 21 fires per year on the Common. Since a single call-out costs approximately £500 (this includes crew salary and a full water tank), roughly £10500 a year is spent on fires alone. The money however, is not the only cost to the Common of all these visits. The impact of the water and the heavy lorries on the plants around the common can ruin an area of commonland in a very short time.
Conclusions
Looking at my hypotheses, I can conclude the following :
The main problem to the Common caused by the public will be footpath erosion.
From the interview with the ranger, it turns out that although footpath erosion is a problem, it is not in fact the biggest problem. Since the new footpath network was put in and the paths were resurfaced with resilient materials, the footpaths are being eroded much more slowly and the only real maintenance work done on them is to replant the heather and grasses around the edges.
Public impact will decrease with distance from the car park.
After testing this hypothesis, I can conclude that this hypothesis is true. There was an almost regular decrease in litter, footpath erosion and dog fouling (the three biggest problems) along the path I studied.
Over £40 000 a year will be spent protecting the Common from damage by the public
This hypothesis was incorrect. In fact, £17850 is spent each year, and even with the installation of dog bins the figure would not reach this figure. I believe this is because there is only one ranger doing jobs such as litter picking and patrolling, so labour costs are not as high as I thought. Also I expected that the footpaths would be resurfaced much more often than they actually were, which would have raised the total annual costs considerably.
Trampling of the plants and heather off the paths will not be a problem for the Common
We can see from my results that 57% of all the visitors to the Common walk over the plants on their visits. The ranger also confirmed that delicate flora is damaged by trampling, and so I can conclude that this hypothesis was in fact wrong. I did not expect many people to leave the paths, and so there would not be a lot of trampling.
The widest range of activities will come from the visitors at Site C
This hypothesis was incorrect. The widest range of activities actually came from Site B, which had at least one visitor fitting into each category. However, this was only because of one person who visited Site B to bird-watch. This is likely to be because it is a sheltered area with a small car park. Fewer people know about it than the big car park, and this makes it quieter than Site C, so they were less likely to be disturbed.
Although the environmental value of the Common is affected by public access, it is not so bad as I imagined before researching it. Places like National Parks have serious problems and have to resort to methods of public control such as zoning to protect the ecology of the site. However, at Chobham Common the public do not seem to have such a big effect. With only four main ways in which the public damage the site, it is relatively easy to keep their effects to a minimum. In total, £17850 is spent keeping the Common’s ecology and habitats as intact as possible, and in the future if dog bins are installed, this figure could rise to £32250. Overall, the Common seems to have a good balance between maintaining its ecological value and being a publicly accessible area.
Contents
Heading Page