I will also try to compare my results with that of a similar river which does not have any sources of abstraction, such as reservoirs, to see how precise my results were in comparison; and the effects the reservoirs had on the channel’s width.
-
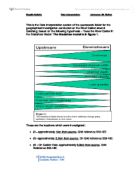
Channel Width:
Why method used was good:
- Novice level; person from group has to ‘simply’ prod ruler into the river – other group members simply read off/check the depth’s result.
- There is not a high volume of water; easier to avoid human error in mantling and reading as group feels safer.
Bad points on method used:
- Proved difficult to keep ruler streamlined and vertical; this resulted in occasional ‘bow-waves’, resulting in inaccuracy;
- Harder to read ruler whilst it was in water as it moved (disillusion), different members of the group provided different readings;
- Meander at site 4 slowed the water’s flow in the outer-bend. Next time we should try to learn the river’s profile more extensively.
- We only had time to measure in stretches of 50m [except at site 2, where we measured in 10m stretches]; therefore precision of results was penalised by time constraints.
We have managed to collect enough data to spot a pattern; this was used to generate a graph comparing the Channel Width and Depth.
A metre ruler was used. We could have used a centimetre ruler for better precision; although this was not necessary in this hypothesis.
This investigation was conducted during summer, a time where there are high levels of rainfall and, often, rain-storms. This results in more rain to fall on River Calder. In addition to this, River Calder gains a larger volume of water when it joins with its many tributaries, this result in a greater depth.
Thus I could possibly visit River Calder during winter (December), when temperatures are near freezing point in order to see how the Channel Depth has changed; how hard it would be to measure depth with possibly thawed water.
-
Water Velocity:
Why method used was good:
- Orange peel is free, lightweight and easy to use and see;
- Method merely involved the correct use of a stopwatch to time the orange peel’s speed.
Bad points on method used:
- Found it tedious to wait for orange peel to travel;
- Never racking - errors were ‘intolerable’ due to time constraints;
- Peel occasionally got stuck, defeating the whole point of experiment – boulders in site 2 (result of sparse water) made it even harder for the orange-peel to travel, and for the ranging-poles to be mantled.
- Timing was inevitably imprecise (to seconds) overall.
Instead of using an orange-peel we could possibly use a flow-meter which can be manipulated more easily, give precise results, and withstand obstacles better. However, this method would cost more.
This geographical investigation took place in the rainy season when a storm prior to our visit occurred; this resulted in the velocity being higher than normal in the upper-course.
If one possibly came back at another time of the year where rainfall was more balanced (ex. winter) to compare the upper-course and lower-course attributes, then the river may fit the Bradshaw Model more accurately.
The chart in the Data Presentation shows how initially, because of the storm, velocity was high, and, gradually, from site 3 onwards, increased – fitting the Bradshaw Model.
-
Gradient:
Why method used was good:
- Used a hand-held clinometre – a simple method which is accurate if used correctly (i.e. angle reset).
Bad points on method used:
- It was vital to be certain the ranging poles were mantled vertically, or else inaccuracies will incur;
- We only had time for 3 readings which rendered a fairly accurate average, but would moderately affect the results if one of the results happened to be an anomaly;
- It was hard to position the ranging-poles on the river bed, rather than on the rocks, especially at site 2, where water was sparse (due to the reservoirs’ abstraction.).
I could go back to River Calder for a more comprehensive study using smaller stretches along the course to increase precision, as the poles will be closer (thus clinometers gun’s angle is more concentrated) – also a greater number of angle-measurements; especially at sites 1 and 5 (upper and lower courses) to see the contrast in change.
I would like to compare my study to a river which is steeper than River Calder in order to compare how harder it would be to point the clinometre gun over wider stretches.
I have plotted my results on a scatter-graph in order to notice the differing changes between each site. For example, between sites 3-4, there was a dramatic decrease in the gradient – which cannot be explained – and could only be accounted for as an anomaly.
-
Discharge:
Why method used was good:
- Most is worked out in other parts; calculations worked out using a calculator.
Bad points on method use:
- If the width, depth or velocity are inaccurate then the result of the discharge will be flawed (as the depth and width are used to find the cross-sectional area; velocity is also a product of the Discharge formula).
- Often when we use the trapezium/triangle equations, some of the values have to be rounded up which can lead to inaccuracies when all of the values are added together;
- This inaccuracy is furthered by the 50cm stretch used between every point along the river’s bed.
The amount of data collected was good, in spite of the time pressure. This was helped by the quick, but rather inaccurate, stretch of 50cm.
If we had a greater amount of time our results may have been slightly different (but more precise). This is because with greater time, we are able to measure the channel width, depth and velocity to a greater precision; which all play a role in calculating the Discharge. For example, we would also be able to lower the stretches from 50cm to 25cm, or less.
Weather was stormy, therefore there was a greater gush of water flowing over an area in less time – this was affected by the velocity; less water would also mean a lower depth.
Thus I would like to investigate an area possibly deeper overall on a hot day, sparse with water, to see whether the velocity changes to fit the Bradshaw Model.
-
Bed-load size:
Why method used was good:
- Easy method to use once one accustoms to procedure;
- Simple equipment to use such as a ruler – low skill needed; virtually anyone could participate to help.
Bad points on method use:
- Starts to become ambiguous after a certain amount of stones; dubiousness as to whether a rock had been measured or not.
- Subjective method, precision may have been penalised – some may think a rock is a certain b-axis, whilst others think otherwise;
- A representative sample of 100 is too small for such a huge population of rocks; an accurate deduction will require a larger sample.
A ruler cannot precisely morph the rocks’ differing shapes; a tape-measure will provide greater flexibility and precision.
A general pattern was evident from the data collected, which fitted the Bradshaw Model; although a more comprehensive investigation would allow me to notice more subtle changes between sites, where it is not clear why the b-axis changes by such amounts.
Weather was stormy which meant greater erosion by Hydraulic Action; thus stones’ b-axis may have been slightly lower than normal as most of the rocks have been eroded at the upper-course. If I was to go back, I would do so on a drier day.
I could also compare my study to a steeper river which has more boulders in the upper-course. This will allow me to see the gradual changes, and compare the two results of the profiles together.
A scatter-diagram was used to present the data – allowing me to make easy comparison, of the b-axis, between all of the rocks at all different sites.
-
Bed-load roundness:
Why method used was good:
- A visual technique was used – one only has to look at the rock to supply result,
- The same rocks from the bed-load size investigation can be used, saving time.
Bad points on method used:
- It is not precise; there was not enough time to fit each rock into the 6 categories of Power’s Roundness Chart. Thus it was simplified to 3 categories: ‘Angular’, ‘Sub-angular’ and ‘Rounded’,
- In spite of simplification, subjectivity was still dominant – it was hard to agree between a category (i.e. it was ambiguous whether a rock was really sub-angular or angular, and which category it would best fit into.)
- Group members presumed that because, for example, a rock was in the upper-course that it would ALWAYS be angular; and vice-versa.
- 100 stones is a small sample out of such a large population, especially in site 5, where the there were more rocks.
- We had five different groups. This decreases accuracy of global results because one group’s opinion on a rock’s roundness differs to another group’s opinion on the same rock.
IF I was to measure all of the rocks’ roundness at each site, on my own, the results will be more pertinent because subjectivity would not be a down factor; as everything will be through one perspective only. (However if my opinion was wrong then all the results would be wrong, making the investigation worthless.)
GCSE Geography Spec.B
Candidate Number:- 4185 Page