Bar Graph:
I made a bar graph to show how signs of tourism in each area compare to each other. The graph shows the amount of litter in each area, the amount of people seen around both areas at the time that we visited, and the amount of cars parked around the area at the time we visited as well. In the graph, it shows that there was a single person near R.H.G, whereas there were 27 people in the area of Pillow Mounds. This, links in with the annotated photo and spider graph where they support the view that there would be more tourism in Pillow Mounds. The other results on the bar graph also support this theory. There was only 3 pieces of litter in R.H.G but there were 30 pieces in P.M. There were also 57 cars parked in sight of where we were in P.M, compared to the 0 in R.H.G.
Pie Chart:
Another form of data presentation that I used was a pie chart. The data on the pie chart is the amount of exposed topsoil in the four, metre square, spots that we visited in both areas (2 in each area). We found that in Pillow Mounds, the amount of exposed topsoil in the two spots was much greater that the two spots in R.H.G. There was 51% and 25% coverage of topsoil in the two Pillow Mound spots and there was only 5% and 6% coverage in the two spots in R.H.G. This shows that there has been more disturbance in the Pillow Mounds than there has been in R.H.G. This evidence supports the evidence from the bar graph, as it suggests more people have been there. The reason that this shows there has been trampling is because if more people are trampling on the plants, they will die and expose more topsoil than areas where there has been less trampling.
Line Graph:
To show the trampling scale results that had been taken in all spots of both R.H.G and Pillow Mounds, I made a line graph. If the ground is more trampled, it means that it has been walked over more and is more flattened. The trampling scale is used to show how trampled the ground is in the area. I found that the area with the highest trampling scale was R.H.G (8). The lowest trampling scale was also in R.H.G but was equalled by Pillow Mounds (1). This evidence does not agree with the evidence of the graphs so far, because it says that R.H.G has had more people trampling it. However, when the averages are done for the trampling scale in both areas, the average is higher in Pillow Mounds than R.H.G. This does agree with the evidence of earlier graphs.
Bar Graph 2:
I made another bar graph, but this one had the evidence for similar results side by side for a different type of comparison. This graph shows the amount of different types of grass in both areas. This tells us about the diversity of types of plant, and the total amount of grass there is. These can both tell us how much people have walked over the ground by showing different amounts of grass etc. In the results, it showed that there was more grass overall, in R.H.G. This supports the evidence from previous graphs that say there has been more tourism/people in Pillow Mounds because it tells us that the grass has been worn away more in Pillow Mounds. However, it shows that there is no Broad leaf grass in one of the spots in R.H.G which means that Pillow Mounds had higher plant diversity. This evidence disagrees with that of the amount of total plants because it shows that more people might have worn away the broad leaf grass in R.H.G. The reason that more people equals less plant diversity is that the ground may have been so badly trampled on, that the broad leaf grass could have died out.
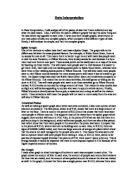
Environmental Quality Survey:
This is the first of the complex pieces of data presentation that I made. The environmental quality survey shows what opinion I had of both areas when I first entered them. It shows things like, how eroded the surface looked from when we first arrived, how clean the air smelt when we first arrived and the amount of traffic on the roads near the area at the time. The results were given a score from 3 to -3 with -3 being the worst and 3 the best. The survey shows that air pollution in R.H.G was -1, and in Pillow Mounds, it was 2. This is because there is a main road fenced off near R.H.G and the pollution was coming right into the area. There was a main road near Pillow Mounds but it was more out of the way. The main road being much closer, to R.H.G meant that there was much more noise. In R.H.G, the noise was -2, compared to 2 in Pillow Mounds. These would both put visitors off from visiting R.H.G, because most tourists would come to the country to escape the noise and pollution of the city. This was supported by the fact that there was a score of -2 for people in Pillow Mounds and a score of 3 for R.H.G. this means that more people were in Pillow Mounds. The only result on the environmental survey which did not support these results was surface erosion. The results said that at a glance, the amount of surface erosion was higher in R.H.G, which is odd, because that would mean that there would have been more people in R.H.G recently. The reason for the oddity of this result may be because in R.H.G there are rabbit hole mounds, which could possibly cause the ground to die and expose the topsoil.
Bar Chart 3:
This form of presentation is also a bar graph, but it is a complex bar graph unlike the other two. This shows the height of vegetation in all spots of R.H.G and Pillow Mounds compared to the soil compaction in the same places. It shows that in R.H.G, the tallest plant was 12 cm and the highest compaction of soil was 4.5/5. In Pillow Mounds, the tallest plant was surprisingly 14cm, and the highest soil compaction was 5/5. These results are relatively similar and don’t tell us much of a difference. However, the average height of plant was higher in R.H.G and the average soil compaction was much higher in Pillow mounds. This tells us that there have been more people in Pillow Mounds because the ground is more compact and the plants are shorter.
Percentage Chart
The final graph that I have made is a complex vegetation percentage graph. This graph shows the percentage of all types of plant and vegetation that I found in the areas. This ranges from grass to baby trees to rabbit poo. It was found that in Pillow Mounds, there was exposed topsoil in all of the spots that were visited. This was even as much as 65% and 61% in two of the areas. There was only exposed topsoil in 3 spots in R.H.G. This tells us the same as all graphs that talked about how much the ground had been walked on each area. And that is that more people have been in the Pillow Mounds and have eroded the ground by walking over it. The survey also shows that there is no rabbit poo in Pillow Mounds, whereas there is some in half of the areas in R.H.G. This shows that there has been more wildlife in R.H.G and that means it is less disturbed by people who would scare away the rabbits. This means more people will have visited Pillow Mounds.
Overall, from these results, it shows that more people have probably visited Pillow Mounds than visited Robin Hood Green. This is because there it had a better environmental quality survey result, has more access points, has been more trampled than Robin Hood Green and has more litter. All of these either mean that there have been more tourists recently or are reasons for the tourists to go there in the first place. This makes me think that Pillow Mounds is more popular.