This graph also shows that 22% of people travelled to Birmingham to work. As working hours in the city centre are similar, as we can imagine the rush to get out of the city and the amount of people getting out is extraordinary. As we know the term “Rush Hour” is used at certain times of the day when traffic is at a high, due to the fact of starting or finishing work times being similar at different work places. The normal “Rush Hour” times are between 7am and 9am as people are getting to work, and between 5pm and 6pm as people are going back home.
Shopping is interpreted in graph to be the third most popular reason for travelling to Birmingham. Due to the new development of the Bullring shopping centre many shoppers internationally have come to shop in this new complex. As we could have predicted whilst the Bullring was still being built, the city of Birmingham would have anticipated this amount of traffic congestion due to this new development, however it was a risk they took and in my opinion the city has suffered from it.
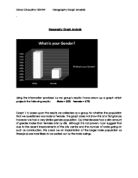
Using the information provided by my group’s results I have drawn up a graph which projects the following results: Car – 26% Bus – 11% Train – 47% Other – 16%
We can interpret from Graph 5 how the people that commuted to Birmingham travelled into the city. The graph is quite blatant in suggesting that the people that travelled by train were a greater majority over the other various methods of transport.
From this graph we can see that some people may have thought wisely about traffic congestion on routes leading into Birmingham and took the train where there would be no congestion. This was almost half of Birmingham’s commuters which took this option and to be precise 47%. As we can presume trains can be used for travelling large distances, i.e. business purposes. Of the 47% of commuters use the train to travel to Birmingham, 17% came for business purposes. However 6% of the 47% came by car, which can cause traffic congestion on routes leading into Birmingham, though not major, congestion, and shouldn’t be such a worry, however if we put this figure on a larger scale it can add up.
As we can expect the commuters that travelled to Birmingham by car came for working intentions. Cars as we can imagine is the biggest source for traffic congestion and can be a hassle to get through the town due the area taken up by cars and the vast amount of them. Of the 100 commuters questioned only 26% of them travelled by car which in my opinion was a substantial drop to what I had expected. 7% of the 26% came to Birmingham for work purposes by car. Cars cause massive traffic congestion due to the amount of people using a 5 seated car for only 1 person. If this is the case for most workers in Birmingham a considerable amount of congestion would be produced. Now if these people used the bus which can carry approximately 70 passengers per bus that is taking a minimum of 12 5 seated cars of the road if the cars are full, and this is a rare case.
Using the information provided by my group’s results I have drawn up a graph which projects the following results: Yes – 51% No – 49%
We can translate this graph and see that there is a split decision between the commuters within Birmingham about personal experiences on traffic congestion. We cannot pull out any information from this graph or from our results on how the differences of congestion on roads are compared to trains because of the question. This is because of the word “ever” in the question we cannot come to a conclusion on what type of transport causes most congestion.
Using the information provided by my group’s results I have drawn up a graph which projects the following results: Traffic – 20 % Vehicles – 18% Road Related – 7% Accidents N/A – 50%
This graph shows reasons for traffic congestion, answered by those who stated yes to the previous question “Has traffic ever caused you problems getting to Birmingham?” I have categorized the causes into sub-headings. These were traffic, vehicles, road related, accidents and those who answered no or couldn’t remember were categorized as “N/A”.
We can associate the “traffic” and “vehicles” sub titles together which come to a total of 38% of the commuters who blame traffic / vehicles on congestion. Most of the causes for these two sections were related to cars blocking roads, “rush hour” period or general congestion. The majority of these commuters travelled by car or bus indicating that road transport is a worse experience in terms of traffic, according to commuters.
The sub section “Road related” applies to numerous things. Road related incidents occurred in only 7% of commuters, which had experienced congestion due to this cause. These causes included road works, traffic lights faulty, and Roads not being organized.
We can interpret from this graph that mainly people did not give reasons or a solution to the traffic congestion on routes leading into Birmingham. If we would take this out of the equation then we can redraw this graph and the percentages of each category will differ.
Using the information provided by my group’s results I have drawn up a graph which projects the following results: Public Transport – 37% Charges – 16% Road Related – 21% Other – 26%
This shows the real picture now as we have taken out the case of people not giving reasons which was classed as N/A. The real main reason that the general public of Birmingham are providing to us on what solution can prevent traffic congestion is public transport. The increase in the number of public transport travelling in and out of Birmingham city centre was a suggestion whilst others suggested enhancing the quality and condition of the public transport, mainly relating to buses as this means of transport has become of less use throughout the years.
Not so many commuters suggested the increase in charging in car parks or the introduction of the Congestion Charge which has already been introduced in the nation’s capital, London. If the council do bring in this scheme of congestion charge it will implement a lack of vehicles driven into the Birmingham City Centre and may encourage Car Sharing. Although these are the positive effects, there are also negative. The commuters may oblige against this and this may execute an increase of commuters walking in the city centre, which could possibly increase the number of street crimes.
Another suggestion that commuters came up with was to develop roads more i.e. increase their size or to introduce more bus lanes. With the increase in road sizes, we can fit more cars on the road or could decrease the amount of congestion as there will be more lanes to fit cars on. This however may persuade more owners of cars to drive into city centre which can increase the number of accidents. If this occurs an accident has potential to cause even more traffic congestion. If the council decide to increase the number of bus lanes in Birmingham this could implement in buses reaching their destinations on time and will take the big vehicles of the road.
Using the information provided by my group’s results I have drawn up a graph which projects the following results: Yes – 29% No – 71%
From the commuters that we questioned within Birmingham City Centre 29% of the population of people answered yes and gave an alternative means of transport. The results for this are as follows:
Train / Tram – 10
Car – 14
Bus – 2
Bike / Cycle – 3
The graph clearly shows that the most popular transport change will be to car. If this change was to be made then the congestion within Birmingham will increase for obvious reasons. As expected the train is also a key prospect that commuters are considering, which in my opinion is the best means of transport as it takes congestion away of roads and it is a much quicker and easier means of transport to the city centre. Buses as explained previously are decreasing rapidly in use; this graph shows similarly as it is the least wanted change of transport.
Using the information provided by my group’s results I have drawn up a graph which projects the following results: Vehicles – 52% Accidents – 4% Congestion – 6% Road Related – 29% Other - 9%
With the subtotal “vehicles”, the commuters of Birmingham suggested many different problems for traffic congestion in Birmingham; however the main problem in the commuters’ point of view is due to vehicles. We can link this cause with another cause that commuters suggested which was “congestion”. Most of the commuters that suggested vehicles were due to too many of one type on the road. From looking at my results I found that the majority put forward the idea that too many cars were on the road, and the main and only real solution for this is to advertise or persuade drivers to car share. If this were to take place there would be a substantial drop in the number of cars on the road, as at the moment greater part of workers own a car, yet many of these have only 1 driver to a car which causes the amount of cars on the road to escalate.
Accidents have not had that many votes for the reason of traffic congestion in Birmingham, due to mainly that if an accident does occur, the ease of getting it out of the way is quite easy unless a major accident took place. An accident causes traffic congestion but only for a limited time and only to certain routes.
29% of travelers were united upon the idea that congestion on routes leading into Birmingham was due to road problems. Some of the road related problems that were suggested were,
- Bad road layouts
- Parking on roads
- Road works
Due to the new developments happening in Birmingham some of the roads will be rebuilt and may be restructured, therefore may eliminate the “bad road layout”, and because of these new developments there are road works which are only provisional. On many of the roads in Birmingham there are no parking zones, however on some roads that branch away from the city centre that have parking spaces there for free, which is going in favor of the commuters mainly shoppers. One solution of this is either building more car-parks or reducing the cost in car-parks.
Using the information provided by my group’s results I have drawn up a graph which projects the following results: Charges – 12% Public Transport – 21% Road Related – 20% Vehicles – 4% Investment – 10% Transport Change – 2%
Within in Birmingham there haven’t been many charges put in place for preventing traffic congestion, however only red routes. Although this means of preventing parking on main roads has been installed, it hasn’t been effective as new report shows, “Traffic wardens patrolling Birmingham’s controversial Stratford Road red route issued almost 7,000 parking tickets in just 10 months, generating about £400,000 in fines for the city council.” On average per month it this figures work out to be that 28 tickets a day. This is a considerable amount, and if we put this into context, shop keepers are losing out on business due to these parking restrictions, so in that case no one is winning.
The improvement of public transport has been identified by many commuters that we interviewed. Many pointed out the fact that buses require the most improvements as they are costing the council to run, and not serving their purpose due to lack of up keeping. Although some still use buses as a means of transport, they are unhappy on the condition of the buses. One commuter who travelled by bus suggested that “either the council needs to improve the buses, other whys take them of the road!” Many of the people, who suggested that the council must develop their public transport links, did actually travel via public transport.
Another suggestion that has been advised by the commuters of Birmingham is to improve and enhance roads. Although this has been bought up as one of the most preferred choices it will take time for the council to provide any solutions to road related matters, because of the vast amounts of road works and ongoing developments in the city centre. Some suggested ideas were to add more lanes to single lane roads,