how brent fits the burgess model
. Introduction
* The location of Brent in Greater London 3
* Urban Models 5
* Aims of the investigation 11
* Applying the Burgess model to Brent 12
* Hypotheses 14
2. Methods 15
* Choosing sites around Brent 15
* Methods of collecting Primary data 16
* Methods of collecting Secondary data 19
3. Results and Analysis 20
* Primary data: Results from the 5 sites 20
* Secondary data: Demographics 44
* Secondary data: The geography of Brent 48
* Secondary data: The value of land 53
* Secondary data: The history of Brent 54
4. Conclusion 60
5. Bibliography 62
The aim of this coursework is to see to what extent does Brent fit the Burgess model. In order to do this I will carryout fieldwork in 5 areas of the London Borough of Brent. I will investigate the differences and similarities of these areas and then see if I can find any evidence for zones of the Burgess Model or whether they fit into another model.
Brent is in North West London and has 21 electoral wards such as:
* Alperton
* Brondesbury
* Dollis hill
* Harlesden
* Kensal green
* Kenton
* Kilburn
* Kingsbury
* Preston
* Stonebridge
* Sudbury
* Tokyngton
* Wembley
* Willesden
* Queensbury
* Fryent
* Barnhill
* Wembley central
* Mapesbury
* Welsh harp
* Dudden hill
Brent is divided into 21 electoral wards it was created in 1965 during the re-organisation of London's Government. The name derived from the River Brent which runs through the Borough. Brent borders Harrow to the northwest, Barnet to the northeast, Camden to the east and Ealing, Hammersmith & Fulham, Kensington & Chelsea and Westminster to the south.
Industrial Revolution and Urbanisation in the U.K
The Industrial Revolution took place in late 18th century and early 19th century, it first started in Britain and then went around the rest of the world, this led to many inventions such as the manufacture of machinery and the introduction of steam power which was fueled by coal, making easier to make things and get work done. In 1913 Henry Ford introduced mass production to speed up production. The production was broken down to small tasks. It was efficient and produced more goods at a cheaper price. The new factories that opened caused many people to move to cites for work. Jobs in farming also declined because of new machinery to do more work. Cities therefore grew rapidly with packed housing growing around the CBD historic centre. Nowadays the production is better than ever before. This links to urban growth because railways changed rural areas like Brent to become part of the urban area of London.
The Burgess Model (The Burgess Concentric Zone Model)
The Burgess model was based on one city, Chicago. It was created by sociologist Ernest W. Burgess in 1923. The burgess model shows urban land use in concentric rings, the Central Business District was in the middle of the model, and the city expanded in rings with different land uses. It contrasts with the Hoyt's Sector Model and the Multiple Nuclei Model. The centre was the CBD, followed by the Inner City, then Inner Suburbs and finally Outer Suburbs. Burgess observed that there was a correlation between the distance from the CBD and wealth. The richer families tended to live further away from the CBD because houses start to get bigger and cheaper as you move away from the CBD. As the city grew, Burgess also observed that the CBD would cause it to expand outwards; this in turn forced the other rings to expand outwards as well. The idea was that urban areas grow equally in all directions, with the oldest, being found closest to centre.
Here are some typical photos of the features of each zone (starting from the CBD to the outer suburbs):
* CBD:
- Centre of all businesses
- Overcrowded
- Very high land value
- Oldest part of the city
- Overpopulated
- Very accessible - Convergence of transport routes
- Grid like streets (small)
- Centre of administration
* Inner City:
- Industrialised
- Houses are much smaller compared to inner/outer suburbs (built in 19th century)
- Flats/terraced houses
- Houses originally built for factory workers
* Inner Suburbs:
- Bigger houses compared to CBD
- Start to get semi-detached houses and bungalows (built in 1920 - 1950)
- Cheaper houses compared to CBD as competition for land is less
- Less population density compared to CBD
* Outer Suburbs:
- Very similar to inner suburbs but houses get even bigger
- More detached houses (built after 1950)
- More peaceful areas compared to CBD
Hoyt's Sector Model
The Hoyt Sector Model was invented by economist Homer Hoyt; this model was different to the Burgess model of city development. Unlike like the Burgess Model this model considered the railways and motorways. They said industries expanded outwards from the city center along railways, motorways, and other transportation roots. Hoyt recognized that cities tended to grow in sectors starting from the central business district and centered on major transportation routes. As the CBD is so accessible it means, higher land values with many money-making functions in the CBD (e.g. shops and restaurants) but manufacturing functions would develop in a sector surrounding transportation routes. Residential functions would grow in sector patterns with a sector of low-income housing bordering manufacturing/industrial sectors (traffic, noise, and pollution makes these areas the least attractive) while sectors of middle- and high-income households were located furthest away from these less attractive functions. Unlike the Burgess model, which only ever attempted to explain a single city (Chicago), Hoyt's model attempted to go deeper in a city, a principle of urban organization.
Multiple Nuclei Model
The Multiple Nuclei Model is an ecological model it was invented by Chauncy D. Harris and Edward L. Ullman in the 1945. Usually a city starts with a Central Business District, similar industries with common land-use and financial requirements are established near each other. These groupings influence their neighborhood. Hotels and restaurants build up around airports, for example. The number and kinds of nuclei mark a city's growth. In this model the CBD is next to manufacturing factories, which is near to the low-wealth residential zones after that the standard residents and then the wealthy residents. When industries became bigger they were pushed away towards the low wealth zones. Also the Sub business district is not only airports but could also be universities (with bookshops, cafes nearby) or even business centres like Wembley.
Aims of This Investigation
In this coursework I hope my coursework answers a few questions such as:
* According to the Burgess model, what would you expect to find in an area like Brent?
* What things world we expect to change as we move from South Brent to North Brent?
- Will the quality of the environment improve or become worse as we go from South Brent to North Brent?
- Will the area get quieter or busier as we go from South Brent to North Brent?
- Will the area become wealthier or poorer as we go from South Brent to North Brent?
- Will the age of housing and buildings become newer or older as we go from South Brent to North Brent?
- Will the roads get wider or narrower as we go from South Brent to North Brent?
- Will the quality of housing improve (e.g. bay windows) as we go from South Brent to North Brent?
- Will the cost of land increase or decrease as we go from South Brent to North Brent?
* According to Hoyt's model and Multiple Nuclei Model, what would you expect to find in an area like Brent?
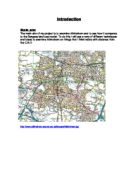
Map of London with Burgess Model:
This is the map of Greater London applied to Burgess Model. This shows Brent is covered by inner city zone, Inner suburb zone and Outer suburb zone. The following diagram will particularly concentrate on Brent, showing what areas represent which zone.
Map of Brent with Burgess Model:
Both he previous diagrams make it much easier to make my hypothesis. It gives me a much of a better idea of what I expect as we move to different parts of Brent. It is also easier because I know what zones lie in Brent, therefore I will make my hypotheses of how much Brent fits into the Burgess model.
My Hypotheses:
My hypotheses are a series of statements of my expectations of changes as I move from South to North Brent. During my investigation I will be comparing with my primary and secondary data.
* I expect that there will be more detached and semi-detached houses as you move from South to North Brent.
* I expect newer houses with features such as bay windows, pebble dashing and garages as you move from south to North Brent.
* I expect that there will be more greenery, open space as you move from South to North Brent because houses will have bigger front gardens and more open space overall with less grid like roads.
* I expect less transport services as you move to North Brent because it's a more peaceful area unlike the middle of Brent, where workers who work in the CBD would travel to go to work so they would need transport. Also in North Brent the population decreases compared to South.
* I expect house prices to decrease for the same size house as you move from South to North Brent because the South would be closer to the CBD.
* I expect the environment quality to improve as you move from South to North Brent because North of Brent is newer.
* I expect longer wider and less grid-like streets as you move from South to North Brent because there is more open space.
* I expect the cost of land to get cheaper as you move from South to North Brent.
* I ...
This is a preview of the whole essay
* I expect house prices to decrease for the same size house as you move from South to North Brent because the South would be closer to the CBD.
* I expect the environment quality to improve as you move from South to North Brent because North of Brent is newer.
* I expect longer wider and less grid-like streets as you move from South to North Brent because there is more open space.
* I expect the cost of land to get cheaper as you move from South to North Brent.
* I expect the housing density to decrease as you move from South to North Brent.
* I expect the roads to be less grid like and more wider as we move from South to North Brent.
What do you expect in an area like Brent according to the Burgess Model?
* I expect there to be more terraced houses in South Brent as it is the Inner city, followed by more semi-detached houses in the Inner suburbs and finally more detached houses in the Outer suburbs (North Brent).
* I expect there to be both different characteristics of the other two models (Hoyt Sector Model and Multiple Nuclei Model) such as the outer business districts.
* I expect the land use to be more spread out in North Brent than in South Brent
* I expect the statistics of Brent will show more unemployment and dependency in the South of Brent, (Inner City) however this would be lower in North of Brent.
* I expect the history of Brent to have similarities to the Burgess model showing the Industrialization.
Now I will put my hypotheses in my investigation to see, to what extent does Brent fit the Burgess Model.
Choosing Sites around Brent
I choose my sites by applying the Burgess model on the map of Brent. This allowed me to see which zones lied in Brent. I found that it was the Inner city, Inner Suburbs and finally Outer Suburbs. Therefore I choose my sites very equally to see the differences between North and South Brent and achieve my primary data. The diagram below shows the 5 sites I choose.
The five sites that I will collect my primary data from are:
- Queens Park (Inner City)
- Willesden Green ( Inner City / Inner Suburbs)
- Dollis Hill (Inner Suburbs)
- Preston (Inner Suburbs / Outer Suburbs)
- Northwick Park (Outer Suburbs / Inner Suburbs)
Methods of Collecting Primary Data:
I will now list several different methods of how I am going to collect my primary data from the 5 sites chosen. These methods were used in the fieldwork booklet I created to record my data. I visited these 5 sites in my spare time to collect the data. Primary data is based on a small sample therefore this gives us a less accurate information than a bigger sample, however a bigger sample is a long-lasting process and therefore information is more reliable and it is easier to notice patterns unlike small samples. Moreover this investigation in particular shows primary is more useful because the data is collected ourselves making the accuracy in our control.
The following table shows the range of methods I used
Method
How will this be done (equipment used, date completed)
The purpose of the method and why it was chosen
Problems encountered and how they were overcome
Counted the different types of houses and buildings on a street
I recorded this in a Tally chart. Each house or building is recorded separately
To see the different styles of houses in different areas and see which house type is most common
Counting flats was very difficult because you can't count the number of flats inside therefore you just count each block of flats as one despite of the number of households.
Counting the number of houses along a 100m strip
I recorded this in a tally chart and counted the number of houses on each street.
To see the differences between different areas e.g. some areas have larger roads but less houses because they are bigger.
Counting flats was very difficult because you can't count the number of flats inside therefore you just count each block of flats as one despite of the number of households.
Recording the various features of a house
This is recorded on a tally chart
To see how modern the houses or buildings are
Some features were not in the tally therefore we put it down as other
Estimating the age of the buildings
This is recorded on a tally chart by looking at the appearance of the house
To find out how old most of the houses or buildings are
When you estimate it, it is hard to give a correct answer therefore I made wide age ranges e.g. 10-20 years old
Taking photos of the site
Pedestrian Count and Car count
Pictures are taken using a camera
Count the number of Pedestrians and cars passing within 5 minutes
To investigate the houses features and see what type of housing is in the area
To investigate the differences in population and congestion in each area
The photos may not suggest that all houses are like that in the area e.g. if a picture of a flat is taken it doesn't mean this area only has flats and that's it.
Some streets were busy than others whilst walking in the area, therefore the method is not really good.
Collecting Secondary Data:
In addition in this investigation I will also use secondary data. Even though we do not know how accurate this information is and how it was collected, it is much quicker and easier to use because it has a wide range of data. My secondary data consists of Demographics, History of Brent, the geography of Brent and finally the cost of land.
Demographics - Demography is the statistical study of all populations. It is a measure of size and structure e.g. a size of a ward in Brent. Therefore I will be achieving the demographics of Brent to see the population of its wards, employment, housing, transport and recreation, crime and finally education. This information will be achieved from the Brent website www.brent.gov.uk. The information will be based on the 2001 census.
History of Brent - I will need to look at the history of Brent to determine the growth of the Borough and industrialization. In addition this will help me with the question; to what extent does Brent fit the burgess model. This information will be achieved from the Brent heritage website www.brent-heritage.co.uk.
Geography of Brent - I will need to be investigating OS and Aerial maps of my 5 different sites. This will allow me to see the amount of greenery and open space there is in the area. Also it will allow me to see how big front and back gardens are for houses. In addition I will also look at how the roads are laid out e.g. grid like. I will be achieving my OS maps from www.streetmap.co.uk and I will be achieving my Aerial maps from www.multimap.com
Cost of Land - I will need to investigate house prices for each site I visited, this will show me whether one of my statements is correct, 'the cost of land will get cheaper as you move from South to North Brent'. I will obtain house prices from www.rightmove.co.uk. I will also compare house prices of three bedroom houses for each ward and will do this by doing a chloropleth map of Brent.
I will now present my primary and secondary data which will allow me to examine and see if my hypotheses were correct or not.
I carried out data from five sites: Preston, Willesden Green, Dollis Hill, Northwick Park and Queens Park. This data will be presented below in my Primary data from the methods I mentioned previously. I will go in order from the closet to the CBD to the furthest.
Queens Park:
* What zone it belongs to: Inner city zone
* Address: Chevening Road, Queens Park, London NW6
* Date and time visited: 22/02/07, 1:20 pm
* Area: Chevening Road lies on the same road as Winchester Avenue which is off Willesden Lane.
Types of Houses:
Age of Housing:
Environmental Quality Survey:
Photo of a typical house:
This house in Queens Park is built in the 19th Century. There are no bay windows and all the windows are single glazed. Also front gardens are averagely big, however really only space for one car. On the whole the area looks well maintained with natural features such as the tree in the picture. Also the roads seem to quite clean as well, however we do not know how the rest of the street is. The other parts of the streets may be vandalized with litter everywhere. Overall this does not fit the burgess model because in the inner city zones there should be terraced housing which is quite run down. This could mean there was redevelopment in the area. On the whole Queens Park does not fit the burgess model because it shows signs of redevelopment in the area also there are more semi-detached housing rather than terraced. However to an extent it does have pre-1900 housing.
Willesden Green:
* What zone does it belong to: Inner City / Inner Suburb zones
* Address: Dartmouth Road, Willesden Green, London NW2
* Date and time visited: 22/02/07, 10:02 am
* Area: Dartmouth Road lies near the station. It is off Lydford Road which is off Willesden Lane.
Types of Houses:
Ages of Housing:
Environmental Quality Survey:
Photo of typical house:
The house in Willesden Green is built in 19th century. This picture shows the building materials are tattered with small front gardens. However there are bay windows which are double glazed. However the second and third floor windows aren't double glazed also there is some greenery. Overall the area looks well maintained with natural features such as bushes. On the whole it supports the burgess model because there is semi-detached housing in inner suburbs otherwise from looking at the picture it looks a bit run down like the Inner city. This picture also does not support my hypotheses because in Inner suburbs the houses are supposed to get bigger however the quality of the environment is improved.
Dollis Hill:
* What zone does it belong to: Inner Suburb zones
* Address: Deacon Road, Dollis Hill, London NW2
* Date and time visited: 22/02/07, 10:15 am
* Area: Near Dollis Hill train station. The area mostly has flats and terraced housing.
Types of Houses:
Environmental Quality Survey:
Photo of typical house:
The house in Dollis Hill is built in 19th century. This picture shows the building materials are improved compared to Willesden Green, where it was tattered, with small front gardens. Houses are now bigger by looking at the picture and also have 2 floors rather then 3. However there are no bay windows and the windows aren't double glazed. Also there are more natural features such as flowers and greenery. Moreover there is a lot more open space, the footpaths have become bigger. In addition the housing density has not decreased as much from the Inner city. On the whole it does not support the burgess model because there is terraced housing instead of being Semi-detached housing. However to an extent it does support the burgess model because houses have become bigger with more greenery, meaning more open space.
Preston
* What zone does it belong to: Inner Suburb / Outer Suburb zones
* Address: Carlton Avenue East, Preston, Wembley HA9
* Date and time visited: 15/02/07, 2:55 pm
* Area: Near Preston road station and school. The area has mostly semi-detached and detached housing. It is on the edge of the inner suburb ring on the burgess model. Also the survey was taken during school; therefore it wouldn't affect the results.
Types of Houses:
The pie chart shows me that semi-detached housing is the most common type of housing on Carlton Avenue East followed by detached. This supports the burgess model because according to the model, the most common type of housing should be semi-detached as it is in the Inner Suburb zone. Semi-detached housing is medium density housing and detached housing is low density housing. Overall this fits the burgess model as Semi-detached housing is medium density. This also shows houses are getting bigger because there is detached housing. It also suggests the area has become suburban as we have moved from the inner city areas like Queens Park. Also Dollis Hill was more of an Inner city area with terraced housing instead of Semi-detached.
Age of Housing:
The bar chart shows the houses in Preston have been made between 1900-1950. This supports the burgess model because semi-detached housing in the suburbs was made during around the period of time. The suburbs was built for those who wanted to stay as far as possible from the Central Business District and Inner city areas where there was a lot of flurry of the industry and poverty and unemployment in Inner city areas. During this period there was the Second World War which may also have affected people to move further away from the CBD. Another hypothesis of mine which supports the burgess model is that the houses are getting newer as you move from North to South Brent.
Environmental Quality Survey:
The radar graph shows that Preston has a very good quality of environment compared to Dollis Hill which was also in the Inner Suburbs however was more like an Inner city ward. The graph shows that everything is better than satisfactory upset for litter. This supports the burgess model because the environment quality is improving as you move from South to North Brent. The litter is not at a good quality simply because it is a school road. The new houses have off street parking making it a 2. Also the roads are much wider compared to the previous sites investigated. In addition gardens have become bigger with bigger front and back gardens with more natural features. Overall this shows Preston has developed compared to the other sites investigated which show concentric development therefore supporting the burgess model.
Photo of typical house:
The photo shows the houses were built after the industrial revolution and have become bigger and there is medium/low density housing, which supports my hypothesis that the density of housing will decrease as you move from north to south Brent. Also there is more semi-detached housing in the Inner suburbs. All the houses have bay windows, double glazing, driveways, garages, wider footpaths, bigger front gardens, greenery and better building materials. This also supports my hypothesis houses will get newer with features such as bay windows, pebble dashing and garages as you move from south to North Brent and that there will be more greenery, open space as you move from South to North Brent because houses will have bigger front gardens and more open space overall with less grid like roads.
Northwick Park:
* What zone does it belong to: Outer Suburb zones
* Address: Rushout Avenue, Northwick Park, Harrow HA3
* Date and time visited: 22/02/07, 1:05 pm
* Area: Near Northwick Park station. Rushout Avenue is off Kenton Road. The area has mostly semi-detached and detached housing.
Types of Houses:
The pie chart shows me that semi-detached housing is the most common type of housing followed by detached housing on Rushout Avenue. This supports the burgess model because there is supposed to be a mix of both semi-detached and detached housing in the outer suburbs. However starting from Queens Park there has not been much of a major pattern of change in house types showing because there was semi-detached in Queens Park, semi-detached in Willesden Green, and terraced in Dollis Hill and semi-detached in Preston.
Age of housing:
The bar chart shows the houses in Northwick Park have been made between 1900-1950. This supports the burgess model because the houses are supposed to be built during the 20th century. It also supports my hypothesis; houses are supposed to get newer as you move from South to North Brent. However the houses should have been built after Preston because it was developed after. Queens Park, Willesden Green and Dollis Hill is pre 20th century, and Preston and Northwick Park is after 20th century.
Environmental Quality Survey:
The radar graph shows that environmental quality is outstanding with each section on 2. This fits the burgess mode because as you move from south to north Brent because, traffic reduces, the population decreases and the quality of the environment are up to its best, and this shows concentric development. The graph also shows the area is much more peaceful and much more modern, compared to the inner city and inner suburbs. This supports my hypothesis; the environmental quality improves as you move from south to north Brent, meaning the area is for high class residential.
Picture of Typical Housing:
The photo shows the houses are getting bigger with low density housing. The house shown in the photo seems a bit tattered in building material, as it is wearing out, however other houses on the street well very well maintained. This house shows how big the front gardens have got; starting from Queens Park there is a major difference. The house is semi-detached which supports the burgess model, because there is supposed to be a mix of semi-detached and detached. It also supports my hypothesis that houses get newer, bigger and modern as you move from south to north Brent because of more open space etc.
Counting the number of houses along a 100m strip:
The bar chart shows that Northwick Park has the lowest number of houses in a 100m strip, therefore lowest housing density supporting the burgess model and my hypothesis because the housing density is supposed to decrease as you move from south to north Brent. Dollis Hill has the highest number of houses in a 100m strip, therefore the highest housing density, simply because it has terraced housing which is high density housing, even though it is in the Inner suburbs. Queens Park and is very similar even though it does not have terraced housing it is semi-detached housing. Willesden Green has got semi-detached housing, however still has a surprisingly high density housing. Preston has got low density housing with the houses semi-detached and some detached. Northwick Park has the lowest density housing as it is in the Outer Suburbs with enormous semi-detached and detached housing. This supports the burgess model because the bar chart shows the housing density has decreased as you move from south to north Brent. However Dollis Hill is an exception as it is more like an Inner city than an Inner suburb.
Housing Features:
The different features of housing shows us how well kept the wards are, as well as the wealth of the area. As you can see by the graph it shows us the overall best housing features is Northwick Park and Preston because the area is in the Outer Suburbs which is newer than the Inner city and Inner suburb areas. However you have to take in consideration that there are fewer houses on a street in Northwick Park than in Dollis Hill, Willesden Green and Queens Park, therefore the table may look a bit off key. Also the graph shows us that Preston and Northwick Park are the only places to have all their houses with garages and big front gardens. Also it shows not all the houses in Northwick have extensions, this could be because the houses there are already really big. This supports the burgess model overall proving my hypothesis I expect newer houses with features such as bay windows, pebble dashing and garages as you move from south to North Brent. It also supports one other hypothesis that houses increase in size as you move from south to north Brent, because Preston and Northwick Park have big front gardens and drive ways and garages therefore the houses are much bigger.
Number of Pedestrian and Vehicles passing within 5 minutes:
Secondary Data: Demographics
Now I will be presenting the demographics of Brent. This will provide very accurate and reliable data provided by the Brent Council website based on 2001 census.
Population Density:
Economic Activity:
Overall Willesden Green has the lowest unemployment in all the categories and Northwick Park has the highest unemployment. Queens Park should have the highest unemployment and Northwick Park should have the lowest unemployment according to the burgess model. In this case Willesden Green is more like an Outer suburb ward rather than an Inner suburb ward. Overall I think employment increases from North to South Brent because people who work closer to CBD would rather live in the Inner city or Inner suburb areas so that they do not have to travel all the way from the Outer suburbs. This explains how the Burgess model is very old and it was only correct for the time it was made in, not showing things like redevelopment that could happen later on, like now transport is used much more compared to before. Therefore the unemployment levels per ward challenge the Burgess model, as it does not explain transport routes and many other things, so cannot explain, why Willesden Green has low unemployment levels.
Housing:
The graph shows that Queens Park has the most number of semi-detached housing. The number of semi-detached increases from Queens Park to Preston, but you got to take in consideration that Preston has fewer houses on one street than Queens Park as the houses are bigger. In Preston and Northwick Park the majority of the houses are Semi-detached as you can see from the graph. Willesden Green has quite a lot of detached houses which is quite strange, because according to the burgess model there is supposed to be more flats and terraced housing and maybe some semi-detached housing in that area, therefore not supporting the burgess model. Overall this graph supports two of hypothesis that is; the housing density will decrease as you move from South to North Brent and there will be more detached and semi-detached houses as you move from South to North Brent. Therefore supports the burgess model. Also from the graph you can see the number flats decreases as you move from North to South Brent. Overall there is not much terraced housing however an exception is Dollis Hill because it has more than 75% of its dwelling as terraced housing. This does not support my hypothesis because terraced housing is supposed to be close to the CBD and in the Inner city areas such as Queens Park and Willesden Green. In the case Dollis Hill is more like a inner city ward, because it has quite a lot of terraced housing for a Inner suburb ward. However the terraced housing in Willesden Green may have been replaced with flats as you can see Willesden Green has the most number of flats, thus showing redevelopment. This also challenges the burgess model because the most of flats should be in Queens Park followed by Willesden Green and Dollis Hill, which in this case isn't; because Preston has more flats than Dollis Hill.
Deprivation:
The IMD rank is obtained by combining seven fields: rank of income domain, rank of employment domain, rank of health domain, rank of education domain, rank of housing domain, rank of crime domain and rank of living environment domain. Northwick Park has the highest rank, meaning it is least deprived, this supports the burgess model its meant to be the most prosperous ward out of the wards chosen. Willesden Green is the lowest rank meaning it is the most deprived out of my 5 sites chosen. There is a pattern as you can see the IMD Rank is increasing, an exception is Willesden Green but other than that it shows prosperity is increasing from South to North Brent. The lowest rank should be Queens Park followed by Willesden Green, Dollis Hill, Preston and Northwick Park, therefore this doesn't support the burgess model.
Overall the demographics support the Burgess model; however while investigating the demographics I have noticed the model's limitations such as redevelopment and transport. Willesden Green also was an outlier because it had the lowest IMD Rank, the lowest unemployment levels and had more flats than the Inner city areas; this shows Willesden Green is more like an Inner city ward and the burgess model cannot suggest why, however the Hoyt model can. This is because it concentrates on the transport therefore inner cities developing around the area. This is why Willesden Green is more like an Inner city ward rather than Inner suburb ward. As a result the Hoyt Model also applies to Brent is someway.
Secondary Data: The Geography of Brent
To see if the geography of Brent supports the burgess model I need to see how scattered land use is. I will use aerial maps from the multimap website which will show the following:
* Firstly the distribution of the land
* Secondly how much greenery and open space there is
* Thirdly to see the layout of the roads e.g. grid like roads
Also I will use OS maps from streetmap website which will show the following:
* Show land use e.g. services and major roads in the different zones of the burgess model.
Queens Park
Chevening Road, Queens Park, London NW6
The area doesn't look fully built up and there seems to be quiet a bit of greenery and open space, suggesting the houses aren't too cramped. It also suggests the roads aren't too small and cramped because if they were they wouldn't have enough space for things like trees and tennis courts shown in the map. Overall there is quite a lot of open space in the area. The back-gardens seem to be of a reasonable size, though the front gardens are quite small. Also by looking at the way roads are laid out, it seems to be very grid like, this supports my hypothesis and the Burgess model. The housing density seems to pretty high which also supports the burgess model. The reason for a lot of greenery in an area like this could be because of gentrification within the area.
Willesden Green
Dartmouth Road, Willesden Green, London NW2
The area seems to be quiet built up with quite a lot of greenery and a little open space, however not as much as Queens Park. This does not support the burgess model because open space and greenery is not increasing. However the roads aren't as grid like as Queens Park, therefore supporting the burgess model and my hypothesis, roads will become less grid like as we move from South to North Brent. The housing density seems very which is not like an Inner suburb ward, it's more like an Inner city ward. Also the type of housing is flats rather than semi-detached which is what the burgess model says. In addition the houses aren't really spaced out, so the roads won't be much wider.
The map shows there are three main roads which are A4003, A5 and A407. The map shows there is more than satisfactory open space, this supports the burgess model because open space should increase as you move from South to North Brent. There are lots of schools in the area, a cemetery, place of worship, several sports ground, tennis courts, several car parks, a superstore and also a fitness centre. Also there are two train stations quite close to each other which are Willesden Green and Kilburn. Overall there are many services this shows it has improved from Queens Park because there are more services and also many major roads leading towards the CBD making it more accessible. Also at the top left of the picture the roads are laid out like the CBD (grid-like), however as you look on the other side of the High road and Walm Lane, the roads are much more wider and there is much more space in between each road, suggesting there is more open space and the roads have become wider. This supports the burgess model because the roads are less grid like making more open space.
Dollis Hill
Deacon Road, Dollis Hill, London NW2
The area looks very well built, however there isn't as much as Willesden Green, which does not support the burgess model because as you move from South to North Brent greenery increases with more natural features. There is not much open space and housing density looks very high. This does not support the burgess model because in the inner suburbs there should be semi-detached housing which is medium density housing. Also there should be less grid like roads, and this picture shows roads, which are very grid like compared to Willesden Green. Overall the area is more like an inner city ward; also it has many tower blocks which may have replaced terraced housing in the past. On the left side of the picture there looks like to be industry buildings with the train tracks running right next to it. This fits the Hoyt sector model, because it industry is located near transportation routes, rather than being an Inner suburb ward.
The map shows quite a lot of open space in the area compared to Willesden Green. This supports the burgess model because there should be an increase in open space as you move from South to North Brent. There is still quite a few main roads such as A4088, A407 and A4003 which means accessibility to the CBD has not decreased from Willesden Green, this doesn't support the burgess model because accessibility decreases as move from South to North Brent. There are many services such cemeteries, medical centers schools, place of worship, parking and superstores and three train stations quite close by shows very good accessibility to the CBD, considering Dollis Hill is in the Inner suburbs. However the industrial estates make the area seem more like an inner city than the inner suburb, moreover the burgess model suggests this should be located away from the industry. Therefore does not support the burgess model. In this picture the industrial estate is located near a railway, a station and a few of major roads, which shows it fits the Hoyt sector model as the industry is developing around transportation routes.
Preston
Carlton Avenue East, Preston, Wembley HA9
The area looks to have a lot more open space and greenery compared to Dollis Hill. This supports the burgess model because greenery and open space increases as you further away from the CBD. The housing density seems to be a mix of medium and low, which supports the burgess model because housing density decreases as you move from South to North Brent. Also the road lengths have increased and the roads have become wider, also the roads have become curvier compared to Dollis Hill, where they were straight and very grid like. Overall the area looks less built up than Dollis Hill, this might be because according to the burgess model as you move further away from CBD the area becomes more peaceful and quieter. Also all the houses in the area seem to have bigger back gardens and front gardens compared to Dollis Hill, also supporting the burgess model. Across the picture there is a train track however, there is no industry developing around it, which would suggest the Hoyt Sector model.
There is a lot of open space and greenery in the area such as Forty Farm Sports Ground suggests it used to rural and than had developed. Now it is used by a school. There is a mixture of services in the area such as schools, superstores, place of worship and 2 train stations in the area. The fact there are 2 train stations quite close to each other shows accessibility to the CBD is quite high, therefore this does not support the burgess model, because accessibility should decrease as you move further away from the CBD. This picture of Preston is in the Inner suburbs and very close to the border of the Outer suburbs, moreover accessibility should be low in an area like this according to the burgess model. There are several hotels and a football stadium, this suggests it may support the Multiple Nuclei model because of services develop around the football stadium, and it may be an OBD, (outer business district) which is the centre of entertainment in the area. Therefore Preston supports the burgess to an extent, because it also fits the Multiple Nuclei model.
Northwick Park
Rushout Avenue, Northwick Park, Harrow HA3
The area looks to have a lot more open space and greenery compared to Queens Park. This supports the burgess model because greenery and open space increases as you further away from the CBD. In addition back gardens have become much bigger compared to the Inner City areas. The housing density seems to be low, which supports the burgess model because housing density decreases as you move from South to North Brent. Also the road lengths have increased and the roads have become wider and longer. Overall the area looks less built up than the Inner City areas, this might be because according to the burgess model as you move further away from CBD the area becomes more peaceful and quieter. However the area does have some places unlike Preston such as those shown in blue in the picture not supporting the burgess model.
There is a lot of open space and greenery in the area such as Northwick Park and Kenton Recreation Ground. There are lots of services in the area such as the hospital, golf course, 2 train stations, places of worship and schools. Overall there are quite a lot of services and the 2 train stations suggests it is still quite accessible therefore it does not support the burgess model, because accessibility should decrease as you move further away from the CBD. Also this picture shows that there is overall more space in between each road, showing it is a high class residential area supporting the burgess model.
From looking at all the maps overall it shows that there is only evidence of the Burgess model however there is also evidence of the Hoyt Sector Model and Multiple Nuclei model. The Burgess model has limitations because it is unclear and does not think about transport routes and the life of an Outer Business District. The Hoyt Sector model and Multiple Nuclei model show these limitations, helping to see the land use patterns.
Secondary Data: Number of Cars per Household
Below I have created a chloropleth map using information from Census 2001 from the Brent website. We can take this information as it is very reliable and accurate. It will give us an overall percentage of cars per household.
This map displays the number of cars per household in each ward. As expected, South Brent has the least number of cars per household, as it is in the Inner city areas. North Brent has the most number of cars per household as expected because it is supposed to be the wealthiest areas. As you move to the inner city areas there is more cars per household lying in the 67.2 - 75 zone. However Sudbury is an exception as it is bordering another borough and isn't very wealthy like the other bordering wards such as Kenton. Also Dollis Hill has quite a lot of cars per household even though it lies on the edge of the Inner suburbs. The reason for Willesden Green, Harlesden and Kilburn to have the lowest number of cars per household is maybe because there is high accessibility of other transport such as trains and buses. Overall, the pattern supports the Burgess model. This proves my hypothesis that as you move from South to North Brent the wealthier the area gets. Also there will be less transport services as you move from South to North Brent.
Conclusion
The main aim of this exploration was to investigate to what extent Brent fits the Burgess model. We did this by investigating the patterns such as looking at the amount of greenery and open space in the 5 different wards chosen to investigate. As I investigated through South to North Brent I saw just how much Brent fits the Burgess model. At the beginning of the investigation, I predicted that, as we went from South to North Brent, the accessibility will decrease, the amount of greenery will increase, the housing density will decrease, and the buildings will be much newer, the environmental quality will improve, the prosperity of the area will increase and the value of land will decrease. These predictions were made according to the burgess model. Using the primary data I collected, I explored the urban land-use patterns with the burgess model.
The Burgess model is a model suggesting that as we go further away from the CBD, the newer the land gets, and the land gets less accessible it gets, in addition prosperity increases. The burgess model implies that the CBD is the oldest part of the city and therefore has high accessibility. According to the burgess model Inner-cities should have mostly terraced housing and tower blocks, the inner-suburb areas should have semi-detached housing and outer-suburb areas have a mixture of semi-detached and detached housing.
In my conclusion to this investigation I can say there was some evidence to support the burgess model, however there was some that did not showing limitations to this model, because it did not explain all the land patterns in Brent.
Firstly my primary data of different house types illustrates that Queens Park has more semi-detached housing than Willesden Green and Dollis Hill which are in the Inner Suburbs. The houses in Queens Park, Willesden Green and Dollis Hill were all pre-1900. This does not support my hypothesis as we go from South to North Brent, the age of the housing decreases. Also in Dollis Hill there was a majority of terraced housing which shows it was more like an Inner city area than an Inner Suburb. In addition there was lots of detached housing in Willesden Green. This shows that there is quite a lot of evidence to show that it did not support the burgess model. However there was also other evidence to show that it fit to the burgess model, suggesting that overall it supported the burgess model.
Secondly my secondary data helped me see how much Brent fits the burgess model. The graph of the deprivation levels shows that the overall pattern is that it is decreasing as we move from South to North Brent. Willesden Green having the lowest IMD rank of 9244 and highest rank was 20070 for Northwick Park. However Queens Park was an outlier because its rank was higher than Willesden Green. The aerial photos and OS maps showed the amount of greenery in each ward. The ward with the most amount of greenery and open space was Northwick Park, and the ward with the least amount of greenery and open space was Dollis Hill, this does not support the burgess model because greenery and open space should increase as we move from south to north Brent, and we know that Dollis Hill lies in the Inner Suburb zone. Also Willesden Green had very little open space and greenery compared to Queens Park, which is closer to the CBD than Willesden Green. In addition the OS maps show how accessible the area is, it proved to be that the area gets less accessible as we move from South to north Brent, therefore supporting the burgess model and my hypothesis as we move from south to north Brent accessibility decreases. The graph of unemployment shows that unemployment increases as we move from south to north Brent, this supports the burgess model because people living in the Inner city, are those that have a family which everyone goes to work, however the people living in the Inner suburbs might only have one person in the family going to work, because the are much wealthier.
The chloropleth map shows that there is a general pattern of the wealth increasing as we go from South to North Brent. Most of the households in the Outer suburbs have an overall high percentage of number of cars e.g. Queensbury, Kenton, Northwick Park and Preston. This supports my hypothesis that there is an increase in wealth of as we go from South to North Brent.
Some of the evidence I found showed that it did not support the Burgess model emphasising its limitations. However other urban models such as the Hoyt Sector and Multiple Nuclei model could, this because they include transportation routes etc. The burgess model does not consider transportation, which has a impact on the industry and urban growth.
In conclusion, after my investigation I found that most of my data supports my hypotheses and the Burgess model. However the Burgess model did prove to have some limitations that is why it could not explain Dollis Hill's land use patterns, having industry located in the area and it is in the Inner suburbs with lots of terraced housing. The multiple nuclei model and the Hoyt sector model could explain things like transportation which the burgess model couldn't.
Overall Brent supports to the Burgess model as we can see concentric development by the data showed throughout this investigation. However there was other evidence to go against the burgess model such as the Hoyt Sector model and the Multiple Nuclei model there. Therefore, Brent fits the Burgess model to an extent.
I could have improved this investigation in many ways, by choosing more appropriate sites that go in a straight line from South to North to then see the exact pattern and difference as we move further away from the CBD. This way the data would have been more reliable and accurate.