Presentation Of Data
Tables Of Results
The following tables are the results of our investigation.
They show the:
- pH value
- percentage of moisture content
- percentage of organic content
- percentage of vegetation cover
that each group discovered from each Block studied. These results are illustrated through the graphs that follow.
Results for pH Value from each group:
Results for % Moisture Content from each group:
Results for % Organic Content from each group:
Vegetation Results from each group, for Block 1:
Vegetation Results from each group, for Block 2:
Vegetation Results from each group, for Block 3:
Vegetation Results from each group, for Block 4:
Analysis
Graph 1: From this graph we can see that Block 1 (youngest dune) has the highest soil pH value (i.e. the most alkaline) with a pH value of 7.7, this decreases in Block 2 to 7.5. It then further decreases to 6.4 in Block 3, while Block 4 (oldest dune) has the lowest pH value (i.e. the most acidic) of 6.2.
Graph 2: We can see that Block 1 has the lowest % moisture content of the 4 Blocks with 8%. Block 3 has the highest, with 40%, which then decreases in Block 4 to 33%.
Graph 3: From this graph we can see the Block 1 has a very low % organic content of 3.5% –the lowest of all 4 blocks. It then increases to 20% in Block 2 and then 26% in Block 3. It then decreases in Block 4 to 21%.
Graph 4: Comparing the relationship between % moisture content and % organic content we can see that both increase in Blocks 1,2 and 3 – to 40% moisture content and 26% organic content in Block 3, then they both decrease in Block 4 to 33% moisture content and 21% organic content.
Graph 5: From this graph we can see how the pH value is decreasing while both % moisture content and % organic content increase. The pH value decreases from 7.7 in Block 1 to 6.2 in Block 4, while the % moisture content increases from 8% in Block 1 to 40% in Block 3, then decreases to 33% in Block 4. The organic content increases from 3.5% in Block 1 to 26% in Block 3, and then also decreases in Block 4 – but to 21%.
Graph 6: The graph shows that there is neither Heather or Moss found in Block 1. This increases to 45% of heather and 40% of moss in Block 2. Block 3 supports the highest amount of both, 55% of heather and 71% of Moss, which then falls to 51% of heather and 60% of moss in Block 4.
Graph 7: By looking at the % marram grass found on each block we can see how Block 1 has an extremely vast amount – 82%, this dramatically falls in Block 2 to 9%. The lost percentage of marram grass in found in Block 3 with only 2%, which then increases to 7% in Block 4.
Graph 8: From the graph we can see that there is 73% bare ground found on Block 1 with hardly any vegetation except marram grass which is 23% of vegetation cover.
Graph 9: On Block 4 there is very little marram grass (2%) and bare ground (2%). However, there is a high percentage of heather (51%) and moss (60%).
Interpretation
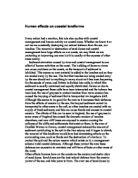
From the graph 1 we can see that the younger dune (Block 1) has the more alkaline soil while the older dune (Block 4) has the more acidic soil. The younger dune is more alkaline due to the western rains in this area that dissolves shells from the shingle beach into the soils of the younger dune. This is known as leaching, shown by the diagram to the left. The soil on the older dune, however, is more mature with more decomposition of dead organic matter with organic acids that are then released into the soil. The lack of organic acids released into the soil in the younger dune is due to the small variety of vegetation which causes little organic content to be found, as shown by graph 3.
The soils pH value affects the variety and amount of vegetation that is able to grow on sand dunes. Few plants are able to survive in the younger dunes due to the alkaline soils and lack of nutrients from dead organic matter. We can see this through graph 8 where the main percentage of vegetation cover is marram grass and bare ground, with no heather or moss etc. Marram grass is an ideal plant to grow on the younger dunes because it is able to grow in the rough textured alkaline soil. It is also able to withstand the other harsh conditions on the younger dunes. These harsh conditions would include very little shelter, so the marram grass would be constantly hit by sand that is blown by the wind. The marram grass is well adapted to deal with this though – it has a smooth waxy surface and so can withstand the constant blowing of sand. Marram grass is useful to the soil too because its roots help to keep the soil together and prevent it from falling apart. From graph 7, we can see how marram grass is better suited to younger dunes than older dunes which is why there is such an immense amount growing on the younger dunes instead. On the other hand, the older dune is able to support a variety of vegetation, including heather, moss and a small amount of lichen – this is illustrated by graph 9. This is because of its soil which is rich in acidic nutrients – ideal for these plants to grow. Additionally, because there is such a vast amount of vegetation on the older dunes there is more sheltered areas for plants to grow in protected from wind blown sand and the sun, therefore younger plants have a higher success probability to survive than they would in the younger dunes.
From graph 2 we can see how the younger dune has the lowest percentage of moisture content. This is because the younger dune has a small amount of organic content and so the soil is not able to hold as much moisture. The older dune, however, has a high organic content and as a result has a high moisture content. The relationship between moisture content and organic content can be seen in graph 5, where, as the soil moisture increases the organic content also increases.
Conclusion
We predicted that the soil would increase in acidity as the dunes increased in age. This prediction was correct, as seen in graph 1 – the pH of the soil in the younger dunes is high (i.e. it is more alkaline); while the pH of the soil in the older dunes is low (i.e. it is more acidic).
We predicted that both soil moisture and soil organic content would be more in the older dunes than in the younger dunes. This prediction was partially correct. From graph 4 (or graph 2 and 3) we can see how both these variables increase in the first, second and third dune but then decreased in the fourth dune. We had not predicted this – we predicted that the soil variable would further increase in the fourth dune as well.
We predicted that the variety and amount of vegetation would be less in the younger dunes than in the older dunes. This prediction was correct. By comparing graphs 8 and 9 we can see that the younger dunes has mainly only marram grass growing, whereas the older dunes has a variety of vegetation, such as heather and moss.
We predicted that the percentage of bare ground would be higher in the younger dunes, while smaller in the older dunes. This prediction was also correct – as seen by comparing graph 8 and 9. The younger dune has a high percentage of bare ground, whereas the older dunes have a very low percentage of bare ground.
Evaluation
To receive a more accurate recording on vegetation we could have brought an information leaflet about the different vegetation we expected to find at Murlough. This would have made it easier to identify the variety of vegetation, such as lichen or bracken.
For organic content some results are particularly higher than the average results – they are ambiguous results. This might be because some groups took up parts of the vegetation with their soil sample rather that ensuring vegetation was moved from where the soil auger would take the sample from.
The dunes that we took our vegetation and soil samples from were dunes that are protected from human activities, such as walking or jumping on the dune. An example of the line of protection used would be fences around the dunes and a footpath from the car park to the beach. This would mean that the soil and vegetation of the dunes would not have been affected, and so the results would be reliable.
There may have been some miscalculations with the percentage of moisture content, as results were very high with some and the decrease, seen in graph 2 between Blocks 3 and 4, was not predicted. However, the relationship between moisture and organic content of soil remains consistent in all 4 Blocks (i.e. when one decreases the other decreases, and when one increases the other increases etc). But this unexpected decrease may be due to microclimates formed by the heather. A microclimate is when a small area receives different weather conditions in parts. For example, in this case the heather would provide shelter from rain and wind etc., so in cold weather it would protect other vegetation and the soil – and in warm weather it would block sunlight from them. So, with these microclimates the soil might not have had as much dead organic matter and so would not have been able to hold as much moisture content as we had expected. (I.e. block 4 did not fulfil our prediction that it would also increase in soil moisture content).