The above method is the best for measuring desirability however it can be measured in another way which is less accurate and more susceptible to error. What I aim to do is collect a sample of houses and find the average house price for each ward; the most expensive houses should be in the most desirable areas otherwise they wouldn’t sell. Houses in less desirable areas are harder to sell and should be cheaper. In order to do this accurately I need to take at least 3 houses of the same type, this is imperative because in order to make a comparison between a set of variables there has to be a constant, in this case all the houses will be 3 bedroom semi-detached houses. If I took the price of detached and terraced housing you would expect the detached to be more expensive than the terraced irrespective of the desirability of the area. So I will find the average price for a 3 bedroom semi in all the wards by taking an average of 3. The most expensive will theoretically be the most desirable and vice versa.
What environmental and socio-economic factors can be taken into account when measuring quality of life at ward level?
Quality of life is very open and can include any number of variables that can be used to measure quality of environment, access to services, health, wealth or education. I’m only going to use a few of these in my investigation as it is too time consuming to collect a large range of variables. The ones I will use are:
- Building Quality
- Air Quality
- Noise Levels
These are examples of primary evidence, I will collect it myself, however I will also use some secondary evidence in my investigation from the Worcester county council website, and these are car availability and general health. With these two I will have a total of 5 variables with which to measure quality of life.
Using this information I will have enough to answer all my key questions and also my final question
How the Data was collected
Desirability
Questionnaire: as I have already described I will ask people two questions, firstly ‘are you a resident of Worcester?’, and secondly ‘if given a free choice which ward of Worcester would you rather live in?’ I will record the data in a table keeping a tally of how many people want to live in each ward.
House Price: The house prices can be taken from an estate agents brochure or newspaper or by looking at the property’s on display in the window of the estate agent. 3 semi detached 3 bed roomed houses will be taken from each ward and the average price calculated.
Quality of life
Building Quality: The building quality was measured on a scale of 1 to 5 with 1 being the lowest and 5 being the highest. 100 houses in each ward were sampled with every other house being used to make sure the results were not biased. The same person has to judge each house and use the same benchmarks each time. As there were two wards covered by each group it meant only any two wards would have been measured using the same benchmarks. As a result over the whole city you would get 7 different people measuring building quality all using their own opinion of a rating of 5 or 2 etc. this means the results are not going to be consistent or as accurate as possible.
It is essential that the same person in each group judges the houses because if a different person did it they would inevitably have a slightly different judgment.
We are taking a building quality survey because we want to find the average building quality in that ward as the quality of life is affected by the building quality. Higher quality of buildings means a more affluent area, more expensive houses and a better aesthetic quality and appearance.
I will show an example of each score from 1 to 5 and how they should be judged
Score of 5
(Besford)
- Off street parking
- Clean uniform brickwork
- New windows and frames
- Good quality front door with porch area
- Twin garage
- Large house size
Score of 4
(Diglis Lane, Cathedral Ward)
- Good quality brickwork and windows
- Large bay window
- Small off street parking area- no garage though
- Out of character property wall at front of the building
- Small property size
Score of 3
(Bolston Rd, Cathedral)
- Nice Edwardian Bay window
- Older brickwork
- Much smaller property size
- No on site parking
- Older windows, guttering etc
Score of 2
(Arboretum)
- Very small size
- Plain and unattractive
- No front garden or parking on the property
- Terraced housing
Score of 1
(Warndon)
- Small old property
- Terraced
- Overgrown
- No on site parking
- Small windows, poor quality
Noise Levels
The noise levels were measured using an analogue decibel meter. The map of Worcester which we were given had grid lines on it, at the intersections of the gridlines we took a measurement for the noise levels. The decibel meter had a small opening in the top similar to a speaker that measured the sound. When taking the reading we cupped our hands around the sides of the decibel meter so that the wind blowing across the top of the meter would not distort the result, this was particularly essential next to main roads where there was a lot of wind generated by the traffic so to measure just the noise we had to eliminate the wind.
We want to measure the noise levels because noisy areas are considered undesirable places to live for example next to a theme park or airport. In these places property values is decreased as a result of the noise. Therefore the higher the noise levels the lower the quality of life. The only problem with this is that if the grid lines intersected on a main road the noise levels would be high, if this occurred in two or three places in the same ward and the ward was in fact usually very quiet it would give an inaccurate results. You would need a lot of measurements to take a true or accurate estimate.
Health and car availability
These variables are secondary evidence and have been taken from the Worcester county council website from the census in 2001. They are used to back up the results for the quality of life, although I did not take them they would be very accurate.
The health data is used to measure quality of life, it is a social indicator. Health is defined as a person’s sense of social, physical and mental wellbeing not merely the absence of disease or infirmity. People who are said to be healthy are going to be those who are not ill, but also they are happy, satisfied and generally have a good quality of life. It is perhaps very similar to quality of life in some respects which makes it an ideal factor to use when measuring quality of life.
Car availability is directly linked to the wealth or economic status of a household. Those with more cars must have the money to buy them, insure them, tax them etc and so most have a lot of money or be well off. These people are far more likely to be happy in life and would have a higher quality of life.
Air Quality
Air quality is linked to health and environmental quality. Poor air quality leads to respiratory problems and can kill off plant species. This is a good variable to measure because it has both social and environmental effects.
We measured the air quality with lichenography. This is the study of lichens. Lichens are small plants which are extremely sensitive to sulphur dioxide levels in the air. Different species are more tolerant than others and using this we can look at the particular species in an area and accurately estimate the sulphur dioxide levels. This is one of these easiest methods; the only problem was that if we missed a species of lichen at one of the points it would make the results inaccurate. For example if we found xanthoria parienta in one location, which is common everywhere, but there was also lecidella elaeochroma which we didn’t find it would give a very unrealistic set of results.
Below is the table of lichens and the levels of SO2 they can tolerate.
Data Analysis
In this section I aim to analyze all my results and in doing so answer all my guiding questions and then my final question.
The first two questions regarding how I am going to measure quality of life and desirability have already been answered in my methodology. Now I am going to answer the three remaining questions.
Which wards were perceived as being the most desirable and why?
Desirability
The desirability was made up of two different factors, average house price of a 3 bedroom semi detached and the results of a questionnaire. I am going to follow a similar method of ranking the results. Even though there are only two variables it is the simplest and easiest way as I am not directly comparing those two sets of data.
Using the rank system I can put the wards in order of desirability.
Claines
Cathedral
St John, St Peters, Battenhall
Warndon North
Bedwardine
Warndon south
Nunnery
St Clement
Arboretum
St Stephen
Warndon
Rainbow Hill
Gorse Hill
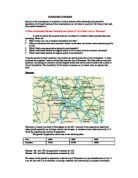
I have plotted this information on a chloropleth map so I can look at the variation in terms of Worcester as a whole.
Which ward/wards has/had the highest quality of life in terms of socio economic indicators?
Quality Of Life
I have used a ranking system to work out the quality of life of different wards, in order to answer this question I need to pick out the social and economic indicators I have used and use them to establish which wards had a better quality of life.
Using the same ranking system I have put the wards into an order of quality of life.
Warndon North
Warndon South
St Peters Parish
Bedwardine
St Clement
Claines
St Stephen
Battenhall
Cathedral
Nunnery, St John
Arboretum
Warndon
Rainbow Hill
Gorse Hill
I have drawn a chloropleth map to illustrate these results.
Which ward/wards had the highest quality of life in terms of environmental indicators?
Using this system I can put the wards in order of quality of life using environmental factors.
St Clement, St John
Claines
Warndon North, Gorse Hill
Battenhall, Nunnery
Bedwardine, St Stephen, Warndon
Warndon South
Rainbow hill
Cathedral
Arboretum
St Peters Parish
I have also plotted this on a chloropleth map as it illustrates the results clearly.
Is there a relationship between desirability and quality of life at ward level in the city of Worcester?
The best way of comparing the desirability and quality of life is to draw a graph plotting one against the other; this is the easiest and most effective way of seeing if there is a trend or relationship between the two sets of results.
I have plotted my graph using the scores from the ranking system. The quality of life scores are the combinations of the environmental factors and the socio economic factors.
As is evident from the graph there is a slight trend between the quality of life and the desirability. The trend is unclear and may have occurred by chance. In order to test the strength of the relationship I am going to use a mathematical test that will find the strength for me.
The test I will use is called the spearman’s rank correlation co-efficient. The general formula is- rs=1-6∑d2
n3-n
Where d is the difference between the rankings of the two variables and n is the number of different results for example mine would be 15 because I have used all 15 wards.
Using this table I can work out the strength of the relationship.
rs = 1 – 6 × 234
153 – 15
rs = 1 – 1404
3360
rs = 0.58214
Using the table I have plotted my result. I have found that the relationship is not strong enough to guarantee it did not occur by chance.
The point plotted is very close to the rejection level which is a 5% of occurring by chance so evidently there is a relationship there just not strong enough. The 5% level represents a 1 in 20 chance of the result happening by chance so my result is even less then that.
Conclusion and Evaluation
My initial question was “is there a relationship between quality of life and desirability at ward level in the city of Worcester?” Using all the data I have collected I can now answer that question.
Using burgess’s model lower quality housing is found in the inner areas of the city and housing improves as you move outwards.
Due to higher levels of traffic and congestion as well as industry, air quality should decrease as you move into the centre of a town or city. As a result of the traffic noise levels should also increase as you move into the centre of the city or town.
As houses are of a better quality and larger on the outskirts of a town it means the residents are wealthier and have the space and money to have a car whereas in the centre of town housing is poorer quality and cheaper with less space and so less people would have cars.
Health should also be better near the outskirts of a town as there is better air quality and so les chance of a respiratory problem, there is more open space and a better quality of environment.
These all lead to a general trend that the quality of life should decrease as you move nearer the centre of a settlement.
Desirability is far more complicated than quality of life. People may want to live in a location near the towns centre as they enjoy going out a lot, others may like peace and quiet. Some people may have relatives in a certain area of town and want to live near them, or even away from them. Many people move to an area for a job and will look for somewhere that is easy to get to that job from.
House prices are also a difficult measure to use because assuming the house increases away from the town centre is not always entirely accurate because in the centre land prices are higher although the house may be poor quality that no-one wants to live in and is not very desirable it will still be expensive because its so near the town centre.
Desirability is more intangible and is personal and whereas quality of life will clearly be better as you move away from the town centre desirability will perhaps not. Theoretically there should be a slight relationship as generally most people would rather live in nicer houses which are found on the rural urban fringe.
Using the spearman’s rank correlation co-efficient I established that there was not a strong trend however it was close to the 5% rejection level which means there was a slight trend which was as I believe I should have found.
Problems with Methods
Problems with the investigation
The main problem I found with my investigation was the quality and range of data I was using. In terms of quality of life I was using social economic and environmental data. However I could also have used demographic data and intangible data.
I was also concerned with the quality of the data I was using especially in the building quality survey and questionnaire data which all seemed fairly