I decided that the best way to record the length of building frontages would be using a trundle wheel as it is easy and accurate to use.
Sampling
There are three ways of sampling:
-
Random sampling – which is when you allocate random numbers using a random number tables
-
Stratified sampling – is when you take one ‘layer’ of people or one kind of building.
-
Systematic sampling – this is when you choose a uniform number, like interview every third person or measure every fifth frontage
Sampling is used when the area is too large to investigate every part or the time is limiting you.
The aim of sampling is to avoid a bias few and therefore makes the information collected true.
Also to measure the building frontages I needed to decide which buildings I will measure and which ones I won’t. I decided to measure the buildings by using Systematic sampling as it gave me a wide variety of different buildings also it was fair and accurate. I decided to measure every third shop I passed. This was primary data.
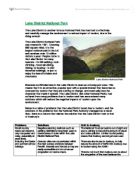
I chose to investigate environmental dilapidation along the transect, because along Mansfield road the environment changes a great deal. I thought this would help me to delimit the edge of the CBD because there is a clear contrast of environmental issues in each zone; also the data I collect will be clear and precise and will assist me with my aim.
I recorded my data by producing a questionnaire. I decided to give the questionnaire to five people in each zone, giving me a total number of 25 questionnaires.
I chose which people to ask to fill in my questionnaire my using the Random Number Table below:
This made the investigation accurate as I did not pick out the people who I thought would answer the questions how I would like them to answer them. This made the information I collected non-bias. If someone refused to answer a questionnaire, I just went on to the next number.
Hypothesis one – TEACHER DIRECTED INVESTIGATION
I predict that the number of pedestrians will increase as I get closer to the CBD towards site 9.
People were positioned and different sites to collect the pedestrian’s data; I was positioned at site 8 which is in zone 5. I recorded the data between 12.00 – 12.10 and 1.00 – 1.10. We all put our data together, the data I collected is primary data and the data collected by other people is secondary data.
These were the results:
A table to show the number of pedestrians counted along Mansfield road at 4 different time intervals.
From my table I have recorded the results of 1.00 – 1.10 on a bar graph, due to the pattern of results being consistent it did not matter which time I record as a bar graph. 1.00-1.10 had the most amount of pedestrians recorded so I chose to record this time as a bar graph as this will make any changes and increases or decreases in pedestrians more apparent. Also on the bar chart I included the mean number of pedestrians recorded.
I chose to show my data in a bar graph as it will present the rises and falls of the amount of pedestrians better than any other graph like a pie chart.
From the graph I can see that the number of pedestrians vary at different time intervals. The time period with the most pedestrians counted was between 1.00 – 1.10pm. The total number of pedestrians at site 8 at this time was 574 but three hours earlier between 10.00-10.10 only 266 pedestrians were recorded. The number of pedestrians has doubled in just 3 hours.
The mean line (on the bar chart) shows a constant positive correlation, the gradient of the line dramatically increases between site 7 and site 8. The pedestrian count falls significantly between site 8 and site 9.
Between site 1 and site 5 the bars are very close in numbers but gradually increase. At site 6 there is a sharp increase of pedestrians. The largest increase is between site 7 and site 8 the pedestrians increases by 361 people.
I calculated the site pedestrian totals in order to see the overall change in pedestrian numbers throughout the site. From site 1 furthest away from the CBD to site 9 the amount of pedestrians increases overall by 993.
The site with the most number of pedestrians counted was site 8, also when I calculated the mean number of pedestrian’s site 8 showed the sharpest rise in the number of pedestrians from site 7 at 151 to site 8 with 398, which is an increase of 247.
Using the information shown on the table and graph I can try to pinpoint the breakpoint of the CBD. Site 8 situated in zone 5 is a popular shopping area and it is just before the Victoria centre, site 8 is ‘Clumber street’ which has shops either side. Site 7 situated in zone 4 is opposite the Victoria centre.
On the bar graph the main change is between site 7 and 8, with a steep gradient and increase between them. This helps me come to the conclusion that the breakpoint between the CBD is at site 6 for this hypothesis.
Hypothesis 2
I predict that the closer I get to the CBD (site 9) the longer the shop frontages.
I walked up and down the transect measuring the length of the shop frontages which were randomly selected from the random number table on page 12.
These were the results.
I produced located pie charts to present the results on page 20,
in order to show me the percentage of buildings at each zone in different length intervals.
The located pie charts on page 20, shows me that the percentage of building frontages between 1-5 metres decreases further down the transect towards zone 4, from 15% at zone 1 to 5% at zone 4. However zone 5 has 10% of the buildings being length 1-5 metres.
There is a large drop in percentage of 1-5 metres between 12% at zone 3 and 5% at zone 4. Also between zone 3 and zone 4 there is a 19% increase in buildings length 15-20 metres. Zone 3 has 35% of buildings under 10 metres long whereas zone 4 has only 19% of buildings under 10 metres
Zone 4 has the largest shop frontages, with a small 5% of buildings 35-40 metres long whereas zone 3 has the smallest building frontages, the longest building measured was between 10-15 metres.
This leads me to believe that the break point for this Hypothesis is between zone 3 and zone 4.
Hypothesis 3 -
I predict that the environmental quality will deteriorate away from the CBD towards site 1 and zone 1.
For Hypothesis 3 I produced a questionnaire which included:
Graffiti
Litter
Building Dilapidation
Pollution
On street Parking
Noise levels
Paint peeling
Open spaces
Amount of trees
The questions were scored on a scale from 1 – 7 (7 being positive) I handed 5 out in each zone by random sampling.
I will present some of the data I recorded as box plots and this will help me to compare the results from each zone and then prove or reject my hypothesis.
Box plots presented on page 24.
The box plots on page 24, shows me that further towards the CBD the amount of Graffiti in the eyes oif the public was positive (zone 5 having a mean of 6 and zone 1 having a mean of 1.5.) This means that the CBD (at zone 5) has less litter than at zone 1.
However zone 3 does not fit in with the trend of the results, there was a varied response to the amount of Graffiti ranging from 1 (negative) to 6 (positive) The mean being 3.
There is a significant increase of the mean between zone 3 and zone 4 of 2, meaning that zone 4 has a lot less Graffiti than at zone 3.
Zone 4 and Zone 5 both have the same mean of 5, however zone 5 has an outlier of 2, this meant that someone believed the area has a lot of Graffiti and was not environmentally friendly.
Zone 3’s top 50% is a lot larger than the whole 100% of zone 4. also the inter-quartile range of zone 3 is 5 this means that the attitudes of zone 3 are very varied.
The data I collected leads me to believe that there are two breaks in the transect line, one between zone 2 and zone 3 and the other between zone 3 and zone 4.
Analysis.
Hypothesis 1
The amount of pedestrians at different time intervals may vary due to the day we recorded the data being a week day. Between 1.00 – 1.10pm there was a total increase of 765 people than between 10.00 -10.10am. This may have been due to that between 1.00-1.10 is at the time in which people have their lunch hours so people will be walking to and from work. Also 10 is quite early in the morning for some people especially if they have to travel far so not all the pedestrians will have arrived in the area we collected our data by 10am.
The graph shows a constant positive correlation from 12 pedestrians at site 1 to 574 pedestrians at site 8. This may be due to there being more retail activity towards the city centre towards site 9 than there is at site 1. Also site 8 was the busiest site because the road which the data was recorded on had places of work and leisure either side. The line of best fit on the bar graph drops between site 8 and site 9 from 448 pedestrians to 258 pedestrians. This may be due to site 9 being in a area with less retail activity also it is further away from the main shopping centre ‘Victoria Centre’ than site 8.
The information which I collected helps me to accept my hypothesis as the amount of pedestrians do increase up the transect line towards the CBD towards site 9 the total increase from site 1 to site 9 is 993 pedestrians.
At site 6 there is a sharp increase in pedestrians from 65 at site 5 to 154 at site 6, I thought that this may be where the breakpoint is along the transect line. I came to this conclusion because site 1 to site 5 have a very small amount of pedestrians the total collected at sites 1-5 is 665 pedestrians, the highest site being site 4 reaching a maximum of 163. whereas the overall pedestrians counted at sites 6-9 is 4029 the highest amount of pedestrians counted was at site 8.
Hypothesis 2
The length of building frontages becomes more varied further down the transect line towards the city centre towards zone 5. At zone 1 there is only 3 different categories of length of buildings where as at zone 5 there is 8 different categories of length of buildings this may be due to zone 5 having more retail activity so has more shops which is also stated in my analysis of Hypothesis 1. The area in which the shops are built is an expensive area so large department stores can afford to buy large shops to make the maximum profit they can whereas smaller businesses can only afford a smaller building with a smaller shop frontage. Also towards zone 1 the buildings become very residential with the odd corner shop this is shown on the model of Nottingham on page . This means that most of the buildings will be of the same size due to most houses being of the same class.
The data I collected helped me to prove my hypothesis that further down the transect line the length of building frontages will become longer.
At zone 1 the longest building recorded was 13.2 metres long whereas at zone 5 the longest building measured was 37.6 metres long this is an increase of 24.4 metres. Between each zone the length of the longest building measure was increased further down the transect line proving my hypothesis that I stated earlier on in my investigation.
The increase in length of building frontage will be also due to the fact that zone 5 has the most retail activity and the land prices will be high so only large department stores can afford the land prices so they buy large store. Also at zone 1 most of the buildings are lower-class residential so will be smaller as they are a place where people live and developers will have built as many houses on to the land as possible, also people will not be able to afford large house.
Hypothesis 2 gives me 2 breaks on the transect line.
One of the breaks is between zone 3 and zone 4 I came to this conclusion because between zone 3 and zone 4 there is a 9% drop in buildings sized 5-10 metres. also zone 4 has 81% of the building frontages being over 10 metres long whereas zone 3 only has 65% of the buildings over 10 metres long between zone 3 and zone 4 there is a 16% decrease in buildings under 10 metres long.
The second breakpoint is between zone 4 and zone 5 as there is an increase of 11% of buildings less than 10 metres long. Also zone 5 has 10% of its buildings amid 35-40 metre long whereas zone 4 does not have any buildings longer than 25.7 metres long.
Hypothesis 3
Towards zone 5 towards the CBD the views on the Graffiti in that area were more positive the mean was 5 (fairly positive) than that at zone 1 this may have been due to the city centre not being used at night so people will not Graffiti in the day, also relating back to Hypothesis 1, Zone 5 has the pedestrians due to it being an area for a lot of retail action so the council will be able to afford for the area to be cleaned each night and any Graffiti that does occur to be cleaned up immediately.
Zone 1 had a fairly negative mean view of 1.5 this shows that the area has a lot of graffiti also it is not being cleared up this maybe due to (relating back to Hypothesis 2) it being a residential area so the council do not think that there is any necessity in cleaning up the Graffiti. Also as it is a residential area many people are there all night so will graffiti the area during the night.
This led me to believe that my hypothesis is correct that the environmental quality will increase towards the CBD towards zone 5.
I think that the break in the transect line is at zone 3 because this is where there is a break in the pattern of results also the views are very varied ranging from 2 – 6 this may be due to the zone being a large area and where about in the zone I handed out the questionnaire also it might depend on the view of the person.
Did I collect enough data and did I have any problems?
For Hypothesis 1 I collected enough information to give me a substantial conclusion, when collecting the information I did not encounter any problems.
For Hypothesis 2 I think it would have been more advisable to have collected a lot more data before I came to a conclusion. I only measured certain buildings down the transect line, using a random number table, I think it would have been more advisable to have measured the length of every building either side of the road to give me accurate results and my conclusion more valid.
When I was collecting the data the problems which I came across were:
- It was difficult to measure shop frontages if they were on a angle, as I was using a trundle wheel to measure the length, however I think using a trundle wheel was the best way of measuring the length of the building frontage.
- Also some buildings which were on the corner of the road I was unsure whether to measure the whole building frontage or just the part of the building frontage which was on the transect line. This should have been made clearer in the method of data collection.
- Some of the buildings were behind a wall so were inaccessible so the actual length of the building was not recorded.
For Hypothesis 3 I also did not collect enough data. I think it would have been more advisable not only to have given out questionnaires for people to fill in but it would have been better to do other research such as actually measure the amount of graffiti and litter at each zone.
The problems I came across were :
- Not all people chosen from the random sample wanted to fill in the Questionnaire and the people who did fill in the Questionnaires might be people who have strong views about the environment so might have swayed the results. This is a difficult matter to improve because you can’t force people to fill in a questionnaire, but it might be more advisable to make the questionnaire a shorter and easier so people did not mind just stopping a minute.
- It took a long time to count the people from the random sample and then find someone who wants to fill in the form, so it was very time consuming, it would have been more wise to choose particular categories of people and then just ask them to fill in the questionnaires.
- It was difficult to explain to people that I only wanted there views on a particular area and not the whole of Nottingham, it would have been more sensible to made the zones smaller so they could see the whole of the area in which they were being asked to comment on.
The disadvantages of each technique
Hypothesis 1 – Using a clicker to count the amount of pedestrians was a great deal better than using a tally chart. The clicker allowed us to keep looking straight ahead without looking down to record a number, also it gave the whole number at the end which could easily be recorded.
Hypo 2 - If I had measured the length of the building frontage with a tape measure, although being very accurate it would be time consuming and would also need at least two people to measure. I decided to use a trundle wheel because I knew I would be arranging my results into class intervals so I would not need to know the accurate measurement.
A trundle wheel was the best to use as it only took one person to measure the building and then record the result, also it was a lot less time consuming than a tape measure.
Hypo 3 - Getting people to fill in a form or Questionnaire is time consuming and people might not always understand also people can have very different views, If I only took into account my view and not other peoples it would make the investigation very bias. If I did research in areas of the CBD and along the transect line it would be very difficult to know where to take my sample from and I may pick a particularly environmentally friendly place of a particularly dirty place.
To increase the reliability of my method I would mix the research on the topics of environmental dilapidation with peoples views on the topics.
How could my results and method been improved?
Hypo 1 - To improve my method I would have differentiated the amount of pedestrians travelling towards the CBD towards site 9 and the amount travelling away from the CBD towards site 1.
Also I would have repeated my results on different days of the week to see if this made any difference to the results.
Hypo 2 - If I were to improve my method I would have measured every single building on either side of the road and differentiated which side of the road it was on. I would have also made it clear that only the building frontage which is actually on the transect should be measured and any buildings that were in accessible should not be measured but would be mentioned when the results are presented.
Hypo 3 - To increase the reliability of my method I would mix the research on the topics of environmental dilapidation with peoples views on the topics. Also I would have collected more data as this would make my conclusion more reliable.
How accurate were my results?
Hypo 1 - From my results I can see that site 3 does not keep in with the pattern of results due to the being 163 pedestrians counted whereas at site 4 there were 132 pedestrians counted. This may be due to human error, that the results were not collected accurately or, due to implausible happenings such as there might have been an activity being held at site 3 which may have attracted more pedestrians. Also these anomalous results may have been due to an inaccuracy in the method, because the pedestrians were counted at only certain times, this may have been the time in which the site was particularly empty or busy. To improve this, the amount of pedestrians could have been counted at smaller time intervals for a longer time.
Also there is another anomalous result at site 9 where it does not fit in with the pattern of results, this may have also been due to human error, however ‘Clumber street’ site 8 is a very busy street due to retail shops being on either side of the road so a lot of pedestrians tend to walk down there but my site 9 most of the pedestrians have branched of to other areas of the CBD, i.e. towards the lace market. However the results also show that site 8 might actually be the anomalous result as the mean amount counted from site 7 is 675 and the mean from site 8 is 1791, this is nearly three times as many pedestrians.
Hypo 2 - It is hard to see the accuracy of results because in the method there is room for human error. Some of the results do not fit in with the general pattern, such as zone 4 has 6 buildings which are 20-25 metres long but zone 5 only has 2 buildings that are 20-25 metres long. This may have been due to human error, or due to the land use in this area, as zone 4 is the zone with the most retail industry most of the shops may be between 20-25 metres long.
Hypo 3 - My results are fairly accurate and have very little anomalous results apart from at zone 5 where most people thought the amount of Graffiti was positive one person thought it was negative, this may have been due to the person recording the wrong thing or miss understanding the question. Or they might just have a strong view point and believe that any graffiti is very negative.
Which results support/reject my Hypothesis?
Hypo 1 – The trend of my results support my Hypothesis on page 4 there are a few results which do not follow the trend of results such as At site 9 1033 was the mean number of pedestrians counted whereas at site 8 1791 was the mean number of pedestrians counted. This means that a lot less pedestrians were counted at site 9 than site 8 although this is the closest site to the CBD.
Hypo 2 - Most of the results have supported my hypothesis (shown on page 4) because most of the buildings closer to the CBD are retail shops which mean they can afford larger areas of land and also need larger buildings to support the capacity of industry. Whereas towards zone 1 which is away from the CBD the main land use becomes more residential and people do not need large buildings to live in, so the length of the building frontages are smaller. Another reason for smaller building frontages is due to the residential housing being that of lower-class so people will not be able to afford large houses.
Hypo 3 – Most of the results collected support my Hypothesis (shown on page 4.) At zone 3 the results do not follow the general trend of results but this may have been due to the method of data collection.
To increase the accuracy of results I would have repeated all my data collections 3 times and used the mean to come to a conclusion. Also I would make the changes in my method shown on page 34.
Conclusions
Hypothesis 1 – The number of pedestrians counted increased towards the CBD, this proved my Hypothesis on page 4. Although my conclusion does support my hypothesis it may not be accurate due to the results not being completely reliable also the data collection was not repeated and the day in which the data was collected may have been a one off day.
Hypothesis 2 – The closer I got to the CBD the longer the length of the buildings, This supported my Hypothesis, this is the most reliable conclusion out of the three as the building remain the same unlike the amount of pedestrians or Graffiti. However not all the buildings were measured so the conclusion may not be completely accurate.
Hypothesis 3 – The environmental quality deteriorated away from the CBD, this also proved my Hypothesis on page 4. Also the conclusion may not be accurate due to the data collection not being repeated, as the day may have been the same day in which areas had just been cleaned and others had not.
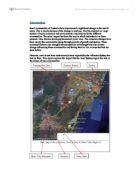
These conclusions are only for Mansfield Road and can not be applied to any other transect along Nottingham. Also the conclusions can not be applied for any other CBD in England or any other country without full research and understanding of the city.
Also the data collected was only a snap-shot in time so the conclusion can only be applied to the time in which the data was collected as the CBD may increase or decrease over time.
Hypothesis 1
If I were to make a new Hypothesis I would keep my original hypothesis as the results accepted my original hypothesis.
Hypothesis 2
If I were to repeat this experiment I would measure all the building frontages to give me an even more accurate conclusion. I would also extend the investigation, and investigate the height of the buildings and how this differs towards the CBD.
If I were to make a new Hypothesis from my conclusion I would keep my original hypothesis that:- The closer I get to the CBD (zone 5) the longer the length of the building frontages.
Hypothesis 3
To improve my method I would have researched just one topic such as litter of graffiti instead of 10 topics then I would be able to go more in depth in this one topic, also I would be able to come to a more accurate and valid conclusion.
From looking at the breakpoints of each Hypothesis on page 30, the conclusions I came up with and the breakpoints I gathered from theses conclusions lead me to believe the actual breakpoint between the CBD and the zone of transition is at site 4.
Acknowledgements
To help me complete my Geography Coursework I used a number of sources to help me obtain information and diagrams of Nottingham. These were:
The Burgess model on page http://www.bennett.karoo.net/images/urban/burgess.gif
The Hoyt model on page
The map of Nottingham
Random sample table
Information
http://www.nottinghamcountycouncil.co.uk