Supply and demand analysis can be used to consider the effect of such negative externalities. Price can be considered to be a measure of the benefit that a consumer derives from the consumption of a unit of a good or service. This is called the private benefit. Like so the demand curve (showing the price that people are prepared to pay for a good or service) can be referred to as the private benefit curve.
The supply curve represents the costs of the factors of production involved in the production of a good or service. Thus the supply curve can be referred to as the private cost curve. In the free market the equilibrium position occurs where the supply equals the demand -where the private costs and private benefits are equal.
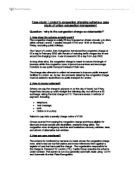
If we consider congestion charging where there are external costs due to a negative externality, the graph below, generalised costs of a road journey involves private costs and external costs. As the volume of traffic increases so the road will be reflected in an increase of the generalized cost of a journey; traffic congestion will increase journey time and petrol consumption through more stop/start traveling. The curve MPC shows the additional marginal costs of a journey and relates to the Marginal Private Costs (the cost directly incurred by each road user). If the demand for journey is shown by the demand curve DD, the predicted traffic flow will be at q1. This number however is not socially efficient.
The reason for this is that the road users do not allow for the “externality” which arises when each person’s to make a journey by a car imposes costs on other road users occurring from each vehicle’s contribution to road congestion. The line MSC shows the marginal social cost of an extra vehicle, when a vertical line between the MSC and MSB appears, this is counted for by the external cost of congestion. Social efficiency indicates an optimum traffic flow, q2.
The existence of road congestion raises two main policy concerns for the government. Firstly, it is associated of managing the existing road network. This suggests that road congestion is currently excessive because road users do not face the full social cost of their decisions. One major way of correcting this concern could be by the government to increase the cost of road journeys to users.
This could include raising motor fuel taxes; however, this is an imperfect policy as the same tax is paid per little whether the road users are on congested or uncongested roads.
This solution is often preferred by means of which there is direct charge for road space by means of tolls. In the graph above, a toll of “ab” could be imposed to equal the difference between MSB and MSC at the socially efficient traffic flow.
The second main concern associated with congestion is that of investments within new road capacity. The presence of large costs associated with congestion apparently creates more pressure to build new roads to ease the congestion. Proposals for such an expansion of new roads in the UK is subject to a cost-benefit analysis which compares the benefits of a new road by the amount saved during generalised costs of journeys, with the costs of constructions for the new roads.
Investigation: Was the Congestion Charge successful?
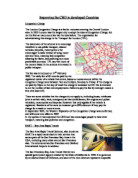
On the 17th February 2003 a charge was put in central London which cost £5 when it had first started, but since July 2005 the figure had risen to £8.
The main aims of the Congestion Charge were to:
- Reduce traffic where it is most congested by between 10-15% year-round, i.e. to school summer-holiday levels.
- Reduce delays by 20-30%
- Shorten journey times
- Make delivery times more reliable
- Save 2-3 million hours of journey time annually inside the zone and a further 4-7 million hours in the area between the zone and the North and South Circular roads
- Raise £1.3 billion over the first 10 years for re-investment in all forms of transport in London, including roads, buses, local streets and railways
- Increase public transport use in the central area by 1-2%
-
Pay for itself within 18 months of starting. ()
In 2001 before congestion charging had began London was in chaos with the traffic and the amount it cost, child causalities and shortage of roads. The graph below shows how people travelled to work in the regions in Britain. As you can see in London, 43% people either drove or were passengers. Nevertheless, London was the third highest region with people who walk to work with 11% of people.
To put that into perspective, in London 43% of people travelled by motor vehicles, 2% of people travelled by bicycle, 11% travelled by bus/coach, 18% travelled by National Rail, 15% of people travelled by the underground and only 11% of people walked to work.
After one year of the congestion Charge, you can see a massive improvement in car travel from the table below.
(http://www.cclondon.com/index.shtmlwww.trl)
From the graph on the last page, the amount of traffic entering the charging zone during the first year had decreased from 141,000 cars each weekday to 115,000 each weekday, on Saturday it had decreased by 1,000 cars and on Sunday/Bank Holidays traffic had decreased by 7,000 cars. This can be shown as a demand curve from below. As the price of travel increase due to the charge, the demand of traffic decreases.
The table below shows the extent of the congestion charge when it first arrived and particularly the case for the amount of cars.
According to the graph above, by 2003 2 years after the congestion charge had commenced, the number of private cars entering the central London congestion charging zone during charging hours had fallen by 33%. On its introduction, the number of cars entering the zone dropped dramatically continuously a less dramatic downward trend that; began in autumn 2002. Since then, some minor fluctuations, the number of private cars entering the zone has remained at around 125,000 cars per day during charging hours.
Even though the number of private cars had fallen dramatically when the charging zones were introduced, not every kind of transport had followed the same trend. As you can see from the graph below, vans and lorries entering congestion charging zones had fallen by 11% since the introduction of the charge. However, the number of taxis that are exempt from the charge had increased by almost 20% and buses/coaches entering the charging zone had increased by nearly 25%. Increase can also be seen in the number of motorcycles by 12%.
In 2004 to 2005, the amount of cars on the roads during the charging hours has more or less been at a constant rate, as seen from the graph below.
So far, from my results the effects of the congestion charge in London are summarised:
- Congestion inside the charging zone reduced by 30%.
- Traffic levels reduced by 18%.
- 30% reduction in number of cars and 65,000 fewer car movements.
- 20% increase in movements by buses coaches and taxis.
- Increase of 29,000 bus passengers entering zone during morning peak.
- Bus reliability and journey times improved - additional time passengers wait at bus stops caused by service delays or missing buses improved by 20% across all of London and by 30% in and around charging zone.
- Bus routes serving charging zone experience 60% less disruption due to traffic delay.
As you can see from the results, the congestion charge has helped slow down the amount of traffic entering the charging zone tremendously. For this matter, I believe that the congestion charge was a success.
However, was it just the congestion charge that helped to reduce the traffic in central London? Some other factors which could have relieved traffic are:
- Increase supply of substitute (public transport)
- Decrease price of substitute (public transport) - a higher demand for public transport.
Increase supply of Public Transport (substitute)
From the table above, you can see that from 2002-2004 since the congestion charge had started there was an increase in most public transport but the biggest increase was the amount of buses used in Central London. From 2002 the amount of bus journeys stood at 4.1 million, by 2004 roughly 1 year after the congestion charge was introduced, that number had risen to 4.8 million bus journeys. This could be a factor why congestion decreased, or just that prices increased in other public transport such as taxis or the underground to the increase supply of bus journeys. Apart from bus journeys, the supply of most other transport had no real significant increase which could have cause the 18% reduction of traffic flow in Central London.
Decrease price of Public Transport
As you can from the table above, that average bus tickets over the past 4 years had certainly decreased from when the congestion charge had been introduced. In 2002 one year before the charge introduced, the average passenger fare per kilometre was 14.3 pence, however by 2003 that number had decreased to 12.9 pence and the following year had decreased again by 12.3 pence. From a result of this, the amount of people travelling on buses increased, this can be sown as below.
The amount of journeys made by buses increased and traffic revenue for buses also showed a 10% increase from 2004-2005. This could be a factor why congestion in Central London had decreased, but perhaps also another reason why more people chose to get the bus to work or to leisure places instead of driving.
When we compare fares from the underground to buses, you can see a major difference since 2000. The underground still cost roughly the same throughout the years 2000-2003 at roughly 16.8 pence per kilometre whereas bus fares were decreasing. When congestion charging had been introduced in 2003, there was a sudden fall by about ½ a pence in underground fares, but I suggest hardly enough to tempt more people into uses their transport than on busses.
Did Everyone Benefit?
However, did the congestion charge benefit everyone in central London; for instance did businesses do as well if less people were entering central London?
As you can see from the table above, in 2001 on average 205,000 people were entering London for sopping purposes, however by 2004 in the table on next page that number had decreased by ¼, only 156,000 people were entering London for shopping purposes. Also the amount of people entering London for business reasons, which could be for business meetings, or work had decreased by 15,000 every day. Has this had a negative impact on how successful businesses have been in the charging zones in central London since the arrival of the charge?
(A questionnaire by the London Chamber of Commerce and Industry.)
Business which support or oppose the congestion charge can be separated into different characteristics. These characteristics can determine whether a company supports or opposes the congestion charge.
The graph below looks at the support from the congestion Charge depending on the type of goods sold by businesses.
There is a greater correlation between support and opposition and the type of goods sold. The greater opposition comes from shops selling food and the least from those who sell luxury goods, where views are approaching a balance. This table suggests that the business which sell food or clothing products have had a greater fall in turnover or gross profits margins since the congestion charge started, and businesses which sell luxury goods have had no real impact on their turnover or gross profit margins. This could be because luxury goods in central London are very expensive and rare to buy, the £8 charge has no effect on wealthy people as they can pay up two 3 times that much just for pay and display parking.
From the next two tables below, you can see how many businesses (depending on the goods they sell or how many they employ) are affected by the congestion charge 2 years after it started.
As can be seen, the companies which sell food, clothes or household goods have had the most impact on takings, turnover and costumers, there is no surprise why their support for congestion charge are the lowest. On average, 72.6% of all companies have had their takings fallen, 78.6% on their turnover fallen and 82.4% of companies have had costumers decreases, just two years after the arrival of the congestion charge. Companies which sell luxury goods have been the least effected in each category, but still over 70% of all companies which sell luxury goods have still seen a decrease in their turnover, takings and costumers.
From the next table, the majority of companies in each category have still seen a decrease in takings, turnovers and costumers.
As you can see, the companies who employed between 51-100 people were most affected, all company asked in that category had seen a decrease in turnover and costumers. On average, 80% of all companies had a decrease of turnover, and 82% had seen a decrease in costumers.
Overall, the least affected by the charge I believe was the companies who employed over 250 people, as only 67% of companies in that category saw a decrease in turnover and 72% saw a decrease in takings. Nevertheless, these figures are still extremely high, and shows that the majority of all business whether their size or the products they sell still did not benefit from the introduction of the charge and saw their turnover decreases and number of costumers decrease, which in the long term could reduce profit levels.
One last factor that businesses have seen a decrease is their productivity. Retailers were also asked if they have benefited from the charge in any way: increases in productivity levels, for example through faster delivery times resulting in a lower cost base. While takings might not have increased, profit margins could have improved. They were also asked a general question, more of a favorability rating, about the ease of doing business. Their answers did not reveal great improvements.
In all cases, the results show that over three quarters of all businesses have found that the congestion charge has not made any improvement on either their productivity.
Where retailers are considering what changes they can make that would offset the negative effects of the charge, one response could be to change the times of the deliveries it both receives and makes. Retailers were therefore asked if they could alter their activities in this way but without incurring costs, which would make it futile. Exactly two thirds of businesses said it would increase costs to make such changes. This was the lowest for those selling luxury goods, at 62.1 per cent, rising to 75 per cent or three quarters for those selling food.
Other possibilities for diversification would be to alter business plans by emphasizing sales over the telephone from loyal customers or an increase in business over the Internet. But this in turn may generate additional costs through delivery activity or may not be appropriate for the type of product sold.
Such changes might well take place where customers are loyal but who do not wish to incur the costs of the congestion charge.
A successful change to conducting business in a new way depends on the complete, or near complete, transfer of existing customers to the new pattern. Not all will follow those who do not have access to the Internet will be unable to follow where the new strategy relies on ecommerce.
Another change that retailers could make to avoid the charge is to relocate their store to a site outside the zone. This is clearly a much more drastic measure than the changes made to delivery times, with substantial cost and other site-related implications. The answer was surprisingly high, with 26.7 per cent of respondents saying that they are considering relocating to a site outside the zone.
There are few options available to retailers to respond to the charge in the way they do business without incurring costs. The most significant response a retailer can make to the negative effects experienced from the charge is to move to an area outside the congestion charging zone. The response from the London Chamber survey revealed that, despite the obvious costs and implications such a response would represent, more than a quarter of retailers, some 26.7 per cent, said that they were considering relocating outside the zone.
This figure is worthy of further work, as it could hide an even higher number of those who wish to move but cannot for a variety of other reasons. There will be other, significant factors at play here. Many shops will be unable to relocate due to terms in their lease. Others may have additional reasons for their location, especially if they live above the premises or depend on the location as part of their marketing in some way.
Whatever the particular range of factors that any individual retail outlet would have to
consider when weighing this decision, what is clear is that the retailer is increasingly caught between being pulled in one direction by the charge and in another direction by other policies such as planning policy or leasehold law.
Conversely, those who have answered yes may, after reflecting fully, feel that this would be disproportionate or would come with other problems which nullify any gains that moving might produce and so decide against it. This would have the effect of reducing the possible effect that relocations on this scale would have.
Analysing further those who answered yes, the highest proportions of those thinking of relocating were the micro retailers, which are frequently newsagents and corner stores, selling food: as many as 36.2 per cent and 36.9 per cent respectively were thinking of moving.
There is no doubt that the congestion charge is encouraging businesses to relocate to areas that are cheaper, as their site would no longer play such a significant role in attracting trade. The higher costs of premium or central locations become increasingly less justified.
Is It Really The Congestion Charge?
There are multiple factors at work in the economy at any one time, all of which may have had an effect on the retail trade. Explanations as to the reason behind any changes which were experiencing in business activity are as follows:
1. Closure of the central line
2. Fear of terrorism
3. Competition from other shopping centers
4. Economic downturn
Conclusion
Overall, from my investigation I can clearly see that introducing a charging zone in central London has definitely reduced the amount of congestion on the roads by a large amount, even though the figure still remains high, over the last few years the number has stayed at a constant rate which is good for the road users. The charging zones had also had a positive impact on public transport as more people take advantage of their public transport and their cheap prices, as bus rates have fallen since the introduction of the charge. Another positive factor that has appeared since the introduction of the charge has been the reality of the busses and much better timetable for all passengers to enjoy.
However, as traffic has reduced by 30% businesses have found the impact of the charge must harder to support. Over 66% of businesses in the central charging zone do not support the charge as their sales and revenue have seen decreases, and over 26% of businesses have considered relocation, away from the charging zones. In this case, the charging zones have had a negative impact and could be considered as a failure. However, the charge was not set out to help business in the same way to help congestion in central London. The aims where achieved and congestion in central London has seen much improvement. Therefore, there is no reason why other Countries have chosen to adopt the same tax in their major cities to help tackle the problem of congestion and the externalities is has on their environment.
Bibliography
http://www.tfl.gov.uk/tfl
UK Commission for Integrated Transport Congestion Charging
The London Congestion Charging Scheme (CCS)
London Chamber of Industry and Commerce