The second aspect we tested was footpath erosion at one of the main hill walking areas in Castleton. We picked one area and measured the width of it. We then divided this width by ten and at every tenth we went along and measured the depth of the footpath. We recorded our data and did this all the way along our part of footpath. We then moved further up into the hills and measured another area of footpath. We did this because we needed to make sure we had more than one set of results so they were accurate and we hadn’t chosen and outlier area. We measured at every 10 centimeters so we got a good representation of the footpath and how much it had eroded.
The third aspect we tested was land usage and we did this by walking around Castleton and noting down on a map what different areas are used for. We went to all the main areas and wrote whether they were residential, shops, pubs, industrial or any other business/accommodation. We did this to find out how much tourism has affected what is in the village and how they have accommodated for the influx of tourists it gets. I drew up my own individual key and marked areas on the map, as shown in figure 9.
The final aspect was a questionnaire. We had 5 set questions and I added one of my own. We walked around Castleton and asked different tourists questions like ‘Where have you come from?’ and questions about the period of time they would be spending in Castleton. We asked 25 people but most of the people we asked were in groups of two or three so our data is representative of about 40 people. We asked tourists to make our data reliable and we moved all around Castleton so we weren’t just getting people from one area.
Own methods
For my own individual test I went around the car park looking to see where people had come from by using their tax discs. On them they have printed which post office they were bought at and this is more than likely where the car had come from. If there were people at their cars I asked them where they were from rather than checking the tax disc. I did it like this because it was a good way to know where people who had come in the car had come from. I asked the people at their cars because this would give me an exact destination. I carried out the survey at about 12 15 as I believed this is when the car park would be at its fullest so there would be lots of data to collect. I took a sample from 21 cars.
Also I asked the people in my questionnaire which age range they fell into from a small chart I had drawn so we could see which age group tends to visit Castleton more. I did it this way so all the data matched and fit together with the questionnaire.
Also I added an extra question to my questionnaire asking which age group people fell into with choices from 10-20 up to 70+ to find out who is most attracted to Castleton. I asked this of the people I questioned so my data corresponded with the other data from the questionnaire and so I had a good range of ages and so I had enough data to make it relevant.
Data Presentation
Figure 4
Figure 5
Figure 6
Figure 7
Figure 8
Data analysis
Figure 4 shows that the majority of people going to Castleton travel by car. This is because the majority of people don’t travel from too far away so a car is the most practical option for them. Also, due to the fact that most people going into Castleton are at the age where they can drive (from figure 6) then it is likely that they took a car as they wouldn’t want to pay for public transport. This is backed up by my data from the traffic count (figure 8) which clearly shows that the vehicle with the highest frequency both towards and away from the centre is the car. T his also may be because it is the easiest way to get into Castleton. It also shows that the next biggest mode of transport that people use to get into Castleton is bus/coach. These people tended to be the older generation from my questionnaire. This corresponds to figure 14 as this graph shows the sphere of influence and that approximately 55% of people come from close by around Castleton. This links to the results from my questionnaire as 72% of people travel by car to get to Castleton so they won’t want to be driving for a long time (a few hours at the maximum). It can also relate to the questionnaire and figure 5 as those coming from close by tend to only be staying for a few hours but those coming from far away tend to be staying for a few days or longer. Figure 15 also shows this as more cars came from closer to Castleton (all but 1 came from England) than further away and the frequency of cars from further away was a lot les than those close to. The anomaly in figure 15 added and extra section in figure 4 and shows that occasionally people come from different countries to visit Castleton and the attractions it holds there.
Figure 6 shows that the age range of people visiting Castleton is wide and quite spread out. This is due to the fact that there are lots of different activities which attract people there and there is something for everyone to do. This can be seen in figure 7 as nearly half the people I questioned went to Castleton for recreational reasons but there is lots of variation in this section (shown in my questionnaire) from nostalgia to grabbing a cup of tea. These two figures (6 and 7) also show that the range of activities is spread out and that people visit Castleton for a multitude of reasons and at any age.
Figure 8 shows that at the time we measured traffic congestion in the morning, more people were going into Castleton and less people were leaving. This may be because it had been forecast to be a nice day so people wanted to get there early to fully enjoy it. However 42% of the traffic was leaving Castleton at the same time and this is probably because residents were leaving for work. It also shows that in the afternoon the amount of traffic congestion was almost exactly the same going towards Castleton and going away from it. This was unexpected as a lot more people on average should have been leaving but people may have been staying longer as they realised how much of a nice a day it was and therefore wanted to make the most of it. This data is shown in figure 10 and 11 but it mainly shows which road is used more and which the main way into Castleton is. Both figure 10 and 11 show that How Lane is the main road into/out of Castleton. Buxton Road is another main road and Pindale road is more of a side entrance that isn’t used often. This may be because people coming from other towns don’t know about it and are more likely to use the roads that are well known. It is most likely that only locals or regular visitors to Castleton use this road as an entrance/exit.
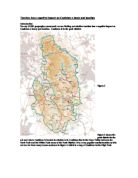
Figure 9 is showing the land usage in the main areas of Castleton. It highlights the different types of buildings in the local area and where the main residential areas are in comparison to local businesses. Most of the residential areas are around How Lane and Mill Lane whereas the shops and other businesses are spread around Cross Street/Buxton Road as well as smaller streets like The Stones. This may be because the main car park is located here as is the tourist information centre. This is where tourists are most likely to go to and having shops close by is a good business opportunity.
Figure 12 and 13 show the footpath erosion in two areas off Pindale Road. Figure 12 shows that the footpath has been eroded quite dramatically across the whole width (maximum of 27cm). The depth erosion doesn’t gradually increase it drops straight away from both edges of the footpath. Figure 13 shows less erosion on the footpath but it is still eroded at 20cm at the deepest. Figure 12 may show the most erosion because people are more likely to walk a short distance up in to the valley and then just stop to look at the natural beauty of the place. Figure 13 may show less erosion because it is higher up and people are less likely to walk up to it.