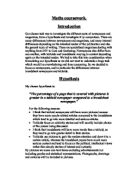
The correlations that I expect to find are quite simple. I think that most people who get within 15% of the line will do the same for the angle. However I feel that generally the length of the line would be more accurate as length seems to stand out more in everyday life as opposed to angles. Throughout this investigation I will try to find out if my hypothesis is correct and use statistical methods in order to prove this.
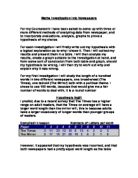
Below is my sample of 30 year 11 students taken from a year group of 86.
Actual result: Length: 7.9 cm Angle: 34 degrees
Glancing upon my sample I have noticed two anomalies, in reference numbers 29 and 69, occurring in the length part of the table. Number 29 states that the person thinks the line is of a length of “73.0” and number 69 thinks that the length of the line is “0.7.” These values are completely inaccurate with regards to the genuine 7.9 length, possibly the student decided upon the wrong units of length and therefore the answers they came up with were wrong. Acknowledging this, I have decided to discard those values and instead pick two more values still using random sampling.
The values I now got were:
Section One:
Finding the margin of error for the length of the line
In this section of the investigation I hope to explain to you what error margin means with regards to the length of the line and what the boundaries should be, in which I have to stick to in order to agree with the hypothesis.
Firstly I will need to find out what the 15% error margin is for line. In order to do this I will use the accurate figure of 7.9 (centimetres) which I found out for the line by measuring it with a ruler. I shall now work out what the error margin above the length of the line is; initially I will do this calculation ‘115/100 x 7.9’ to which the answer is 9.085 (centimetres). The reason I did this particular calculation is because I knew that an extra 15% had to be added on, so I added 15% onto the 100% giving me 115%, I then divided this by 100 to take it out of a percentage. Finally I multiply it by the length of the line (7.9) it then gave me the final result (9.085). However for convenience and considering all the values are in one decimal place, I shall round this up to 9.1.This tells me that the maximum length of the line in order to qualify must be of 9.1 centimetres or below as this comply with the hypothesis.
There is also a 15% error margin for if you estimate below the line, in order to work this out I use this calculation ‘85/100 x 7.9’ to which the answer is 6.715 (centimetres). The reason I did this particular calculation is because I knew that it had to be 15% less than the original amount, so therefore I took 15% from 100% and therefore giving me 85%. I finally divide this by 100 in order to take it out of a percentage and multiply it but the length of the line giving me the final result (6.715). However for convenience and considering all the values are in one decimal place, I shall round this down to 6.7. This tells me that the minimum length of the line to qualify must be 6.7 centimetres or above to comply with the hypothesis.
Section One:
Finding the margin of error for the size of the angle
In this section of the investigation I hope to explain to you what error margin means with regards to the size of the angle and what the boundaries should be, in which I have to stick to in order to agree with the hypothesis.
Firstly I will need to find out what the 15% error margin is for the size of the angle. In order to do this I will use the accurate figure of 34 (degrees) which I found out for the angle by measuring it with a protractor. I shall now work out what the error margin above the size of the angle is; initially I will do this calculation ‘115/100 x 34’ to which the answer is 39.1 (degrees). The reason I did this particular calculation is because I knew that an extra 15% had to be added on, so I added 15% onto the 100% giving me 115%, I then divided this by 100 to take it out of a percentage. Finally I multiply it by the size of the angle (34) it then gave me the final result (39.1). However for convenience and considering all the values are in one decimal place, I shall round this up to 39. This tells me that the maximum size of the angle in order to qualify must be of 39 degrees or below as this comply with the hypothesis.
There is also a 15% error margin for if you estimate below the line, in order to work this out I use this calculation ‘85/100 x 34’ to which the answer is 28.9 (degrees). The reason I did this particular calculation is because I knew that it had to be 15% less than the original amount, so therefore I took 15% from 100% and therefore giving me 85%. I finally divide this by 100 in order to take it out of a percentage and multiply it but the size of the angle giving me the final result (28.9). However for convenience and considering all the values are in one decimal place, I shall round this up to 29. This tells me that the minimum length of the line to qualify must be 29 degrees or above to comply with the hypothesis.
Below are two graphs showing the distribution in comparison to the actual result. The first one is a graph showing the estimations of the length of the line, as well as having another line showing the actual result. From this I can tell how accurate the estimations were. The second graph shows the estimations for the size of the angle, as well as having a line showing the actual result. From this I can tell how accurate the estimations were.
From this I learn that people seem to be roughly the same at getting closest to the actual measurement. Although for the first one I t seems that they tend to be more equal, both higher and lower estimations of the line whereas for the angle, they all seemed to estimate above the actual size of the angle.
Section two
Organisation and analysis of data for the length of the line
Section two
Organisation and analysis of the data for the size of the angle
These pie charts show that 57% of people estimated the line and the angle incorrectly.
However my hypothesis states that those who get within the 15 % of the line will also get within 15 % of the angle, so therefore I am going to create a table which has the figures of those who got within 15% of the line.
From this I understand that 11 out of a possible 17 comply with the hypothesis, this as a percentage gives me 64.70…, and therefore I have decided to round it to the nearest whole number, which gives me 65%.
In my hypothesis I thought that 75% of people who got within the boundaries of the line would also get within the boundaries of the angle however this was not true, as 13 of the 17 people would have had to have got within both the 15% boundaries.
Therefore my hypothesis was incorrect.