
A Day in the life of Tangent - From 'Decline & Fall' - Evelyn Waugh
A Day in the life of Tangent From 'Decline & Fall' - Evelyn Waugh My day starts regularly at six o' clock - never later, never earlier. In fact, I can't remember a day when I didn't rise at six o'clock, prompt. My name is Tangent. Well, I mean, it's not really Tangent - its Llewellyn, but who in their right mind would ever choose to be called Llewellyn? Certainly not me, its a stupid name! So I call myself Tangent. All the other boys at school think Tangent's a brilliant name, and so we have this game with our new teachers at the beginning of term. We all say our name is Tangent. It's very funny, although we made Mr. Prendergast cry last term with it. He'd been ill a long time though, so I suppose it really wasn't our fault. Any way, I rise at six - sharp, mind and I get dressed very quickly in my school uniform and I eat my breakfast, well, really I just gulp it down. And then, at seven, school starts. It's strange, I suppose, because I always look forward to the first lesson of the year. Especially this year because we have a new teacher called Mr. Pennyfeather. We haven't seen him yet, none of us, so we don't know what he'll be like. Thank G-d it's not Doctor Fagan, we already played the Tangent joke on him. He'll be all wised-up, although I doubt he'll remember us. About my school: It's a boarding school, a small one, with twenty classes of ten exactly. It's called The

In the following coursework, will investigate the gradient functions using the formula y=ax^n, where a is a constant and n is a number.
Gradient functions In the following coursework, will investigate the gradient functions using the formula y=ax^n, where a is a constant and n is a number. a n Y=ax^n x 2 2x 3 3x 4 4x 5 5x a n Y=ax^n 2 x 2 2 4x 3 2 6x 4 2 8x 5 2 0x a n Y=ax^n 3 3x^2 2 3 6x^2 3 3 9x^2 4 3 2x^2 5 3 5x^2 a n Y=ax^n 4 4x^3 2 4 8x^3 3 4 2x^3 4 4 6x^3 5 4 20x^3 I will plot the graphs of the functions above and I will find their gradient using the formula gradient=increase in y-axis /increase in x-axis. Straight line graphs Straight line graphs are graphs with the equation y=mx+c or y=ax^1,where is stand for the gradient and c is the y- intercept. Gradient calculations . y=x graph Gradient of A= increase in y -axis/increase in x-axis = 2/2 =1 Gradient of B= increase in y-axis/increase in x-axis = 2/2 =1 2. y=2x graph Gradient of D= increase in y-axis/increase in x-axis = 4/2 =2 Gradient of E= increase in y-axis/increase in x-axis = 4/2 =2 Gradient of F= increase in y-axis/increase in x-axis = 4/2 =2 3. y=-2x graph Gradient of G= increase in y-axis/increase in x-axis = -4/2 =-2 Gradient of H= increase in y-axis/increase in x-axis = -4/2 =-2 Gradient of H = increase in y-axis/increase in x-axis = -4/2 =-2 Gradient of I = increase in y-axis/increase in x-axis = -4/2 =-2 4. y=3x graph Gradient of J=

Maths coursework: gradient function
Maths Coursework . Draw a graph of y = x2 for values of x from 0 to 4. Obtain the gradient of the tangent at different points. Record the results. To conduct this question I first had to obtain the values of y = x2 for values of x from 0 to 4. This is shown below. I decided to use values more accurate and precise values of x to enable me to obtain a more accurate curve and thus enabling me to obtain a more accurate gradient. I took the values of y = x2 and then plotted them on the graph. I rounded the values to two decimal places to enable me to plot the point as accurately as possible on my scale. y y = x2 0.0 0.0 0.25 0.0625 0.5 0.25 0.75 0.5625 .0 .0 .25 .5625 .5 2.25 .75 3.0625 2.0 4.0 2.25 5.0625 2.5 6.25 2.75 7.5625 3.0 9.0 3.25 0.5625 3.5 2.25 3.75 4.025 4.0 6.0 I then joined up the points with a flexi-curve. This instrument enabled me to obtain an accurate curve hence enabling me to draw accurate tangents to obtain accurate gradients. I then checked the points again once I had plotted the curve to make sure that I had not misplaced any points because this could affect my tangents. I then drew the tangents to do this I first took a ruler and a sharp pencil, I then aligned the ruler along the curve making sure that the tangent that was about to be drawn was equally balanced along the line and that the two closest points were the
Mathematics Coursework - The Gradient Function
Mathematics Coursework The Gradient Function Winnie, Jinyue Cao 1 U Cumberland School Aim: to investigate the gradient function for all kinds of curves. Research: What does "gradient" mean? Generally, the "steepness" of a curve is measured by its gradient. We can look at the figure below: This is the curve of y=x2. The point P (3, 9) has been marked and the tangent QPM drawn. The gradient of the tangent is QN/MN. So we can use the "tangent method" to obtain the gradients of graphs of different functions. First Step: I am going to investigate the gradient of y=x, y=x2, y=x3 first because they are likely to be the simplest equations to solve, and after getting these results easily, by looking at them, the more complex equations will seem easier to discover. I am going to look at y=x first because it is the easiest. x 2 3 4 y 2 3 4 Please see graph on separate pieces of paper As we see, the gradients of y=x is very simple, g=1. We even do not need to draw any tangents to obtain the gradients. So the relationship between g and x can be shown in the table below: x g (The Gradient) 2 3 4 So it is extremely obvious that in the graph of y=x, whatever x is, the gradient g stays 1. Then let us try the graph of y=x2. x 2 3 4 y 4 9 6 By drawing the tangents of each point, we can calculate the gradients. However, as the graph is not always accurately
Investigate the gradients of the graphs Y=AXN
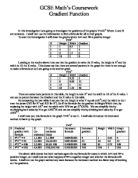
GCSE Math's Coursework Gradient Function In this investigation I am going to investigate the gradients of the graphs Y=AXN Where A and N are constants. I shall then use the information to find a formula for all curved graphs. To start the investigation I will draw the graphs where A=1 and N= a positive integer. Y=X2 X Height Width Gradient 0.5 2 2 4 4 3 9 .5 6 4 6 2 8 Looking at the results above I can see that the gradient is twice the X value, the height is X2 and the width is 1/2 the X value. This shows me that there are several patterns in the graph but there is not enough to make a formula on so I am going to do another graph Y=X3 X Height Width Gradient 0.33 3 2 8 0.66 2 3 27 27 4 64 .33 48 There are some more patterns in this table, the height is now X3 and the width is 1/3 of the X value. I can see no pattern between the Gradient and the X value in this table. By comparing the two tables I can see that the height is what Y equals (AXN) and the width is the 1 over the power (X/2 for X2 and X/3 for X3). So if the formula for the gradient is Height/Width then, by replacing the height with AXN and the width with X/N we get XN/(X/N). We can simplify this by multiplying both sides by N to get ANXN/X and we can simplify this by dividing both sides by X to get ANXN-1. I shall now you this formula in the graph Y=X4 to test it. I
To investigate the effect of the constants a, b and c on the graph y = ax2 + bx + c.
Maths C/W Preparatory: AIM: To investigate the effect of the constants a, b and c on the graph y = ax2 + bx + c PLAN: To begin with, I will fix constants a and b, and will plot several equations with varying c values. I will then make observations, and attempt to prove any theories I discover. I will find out what happens when c increases and decreases, making sure to include negative values of c. I will examine any movement changes when the equation is linear or quadratic. I will try to prove that the graph is symmetrical, and where the minimum point is. I will also try to prove the y intercept. I will then summarise my findings. After that, I will fix constants b and c, and plot equations with varying a values. I will make observations on these graphs, and try to prove any theories I may discern. I will try to explain my findings using diagrams, and will draw up a conclusion. I will draw tangents to certain curves and make observations on the gradients. I will then use calculus to check my tangents, and to also find out the general formula for the gradient of y = ax2. I will make sure to include negative values of a. I will then fix constants a and c, and focus on constant b. I will examine the path of the turning point, and also the gradient of the curve - using both tangents and calculus. I will then fix constant c, and examine what happens when I change constants
Gradient Function
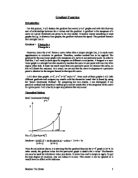
Gradient Function Introduction For this project, I will deduce the gradient for several y=axn graphs and with this find any sort of relationships between the x values and the gradient. A gradient is the steepness of a curve at a point. Gradients can prove to be very useful. It usually means something in most graphs for e.g. in distance-time graphs, the gradient indicates the speed. The gradient formula for a straight line is: Gradient = Change in y Change in x However, since the y=axn forms a curve rather than a simple straight line, it is much more apprehensive to calculate its gradient. Therefore, another method has to be applied. The gradient for the non-linear graph is the steepness of a curve at one particular point. In order to find this, I will need to draw specific tangents on different x-axis points. A tangent in a non-linear graph is a straight line that essentially touches the curve at one point with two tiny alike angles either side. It must not touch more than one particular point or intersect the curve, as this will distort the outcome. As a result, we can say that the curve's steepness at a particular point is identical to the tangent formed in that specific curve. I will draw four graphs: y=x2, y=x3 y=2x2 and y=x-1. From each of these graphs I will infer different gradients and compare my results with the theoretical result that is found by using the

The Gradient Function
The Gradient Function A curve does not have a constant gradient because its direction is constantly changing. The gradient of a continuous curve is y = f (x) at any point on the curve is defined as the gradient of the tangent to the curve at this point. Investigating the Gradient Function for y=x I have gained the following results for x x change from y changes from Change in y / change in x Gradient to 1.1 to 1.21 (1.21 - 1) / (1.1 - 1) 2.1 to 1.01 to 1.0201 (1.0201 - 1) / (1.01 - 1) 2.01 to 1.001 to 1.002001 (1.002001 - 1) / (1.001 - 1) 2.001 2 to 2.1 4 to 4.41 (4.41 - 4) / (2.1 - 2) 4.1 2 to 2.01 4 to 4.0401 (4.0401 - 4) / (2.01-2) 4.01 2 to 2.001 4 to 4.004001 (4.004001 -4) / (2.001-2) 4.001 3 to 3.1 9 to 9.61 (9.61 - 9) / (3.1 - 3) 6.1 3 to 3.01 9 to 9.0601 (9.0601 - 9) / (3.01 - 3) 6.01 3 to 3.001 9 to 9.00601 (9.00601 - 9) / (3.001 - 3) 6.001 3.75 to 3.75001 4.0625 to 14.062575 (14.062575 - 14.0625) / (3.75001 - 3.75) 7.5 3.75 to 3.750001 4.0625 to 14.0325075 (14.0625075 - 14.0625) / (3.750001 - 3.75) 7.5 3.75 to 3.7500001 4.0625 to 14.06250075 (14.06250075 - 14.0625) / (3.7500001 - 3.75) 7.5 When investigating the results the gradient is clearly visible. x Gradient st Step 2 2 4 2 3 6 2 4 8 2 When looking at the first step, there is a constant difference between the consecutive gradients. In
The Gradient Function
The Gradient Function Introduction In this project, I intend to investigate the Gradient Function and then prove how the formula that I get works. The Gradient Function is an important part of calculus and mathematics as a whole. It allows us to calculate accurately the gradient of any point on any graph without using the lengthy procedure of drawing a graph and then a tangent which is still extremely inaccurate - the error can be 20 units. To investigate the Gradient Function, there are two aspects of mathematics that must be made clear from the beginning: what is a gradient? and what is a tangent? A gradient can be described as the steepness of a curve or line and is found by the formula: Gradient of a change in y straight line change in x This is shown in the graph on the left. A tangent is defined as a straight line that just 'touches' the circumference of a circle (as shown in the picture on the right). It is often used in mathematics to find an estimate of the gradient of a curve as it is a straight line, using the formula above. Investigating a simple curved graph I decided to start with the simplest curved graph, x2 to begin my investigation. x 0 2 3 4 y 0 4 9 6 This is the table of values for the graph y = x2. From this I was able to draw a graph which is on page 2. Then, I drew tangents as accurately as possible of four

The Gradient Function
The Gradient Function The aim of this investigation is to try and find a formula to determine the gradient of a curved line (of the form Y=X^n) at any given point. To do this I have drawn the graph Y=X^2, marked on the tangents and from there calculated the gradients. I have labelled the tangents a-d. I then calculated the gradients by dividing the height of the tangent by the length of the base. A. 2.1 / 1.05 = 2 (gradient) B. 3.9 / 1.05 = 3.7 (gradient) C. 4.2 / 0.75 = 5.6 (gradient) D. 5 / 0.6 = 8.3 (gradient) Y=X^2 X Y Height Base Height / Base A 2.1 .05 2 B 2 4 3.9 .05 3.7 C 3 9 4.2 0.75 5.6 D 4 6 5 0.6 8.3 I then used this same method to find the gradients of tangents on lines other than Y=X^2. I drew a graph for Y=X^3 and used the same method to find the gradients. I came up with these results: Y=X^3 X Y Height Base Height / Base A 0 2.7 3.7 B 2 8 5 .2 2.5 C 3 27 27 .05 25.7 D 4 64 27 0.6 45 You can see that these results are adequate estimate numbers but they wont give me a reading accurate enough. There are many inaccuracies in the graph, the biggest being the difficulty of drawing the tangent at the correct angle. Other inaccuracies include the quality of the drawings such as the curve and tangents, the thickness and straightness of the lines and the size of the increment. To get a more