The Gradient Function
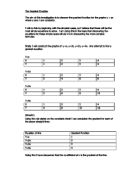
The Gradient Function The aim of this investigation is to discover the gradient function for the graphs y = ax where a and n are constants. I will do this by beginning with the simplest cases, as I believe that these will be the most simple equations to solve. I am doing this in the hope that discovering the equations for these simple cases will aid me in discovering the more complex formulas. Firstly I will construct the graphs of: y=x, y=2x, y=3x, y=4x. And attempt to find a general equation. Y=x X 2 3 4 Y 2 3 4 Y=2x X 2 3 4 Y 2 4 6 8 Y=3x X 2 3 4 Y 3 6 9 2 Y=4x X 2 3 4 Y 4 8 2 6 (Graph1) Using the rule stated on the candidate sheet I can calculated the gradient for each of the above straight lines. Equation of line Gradient Function Y=x Y=2x 2 Y=3x 3 Y=4x 4 Doing this I have discovered that the co-efficient of x is the gradient of the line. I will now go on to construct the graph of y=x2. This is because I know that the graph of x2 will be a curve and it is curves that I am investigating X 2 3 4 Y 4 9 6 To find the gradient of this line, I will use the tangent method. If I have a point on the curve, I will draw a tangent so only the point on the curve is touching the tangent. I will then draw a right-angled triangle with the tangent. I will then take the values of the opposite line y and the adjacent

The Gradient Function
The Gradient Function Introduction: In this investigation I am going to investigate the gradient function of different lines. I am going find out the gradient of each line and then look at all the different gradients. With these different gradients I am going to comment on the difference of the value of the different gradients. Observations: I can see that the gradients have got bigger, the bigger the line. For example: THE AVERAGE GRADIENT OF y = x is 1 THE AVERAGE GRADIENT OF y = x (3 is 9 I can see that each 3 gradients on each line are positive on the lines of y = x (3 y = x (3 GR 18 GR 8 GR 1 y = 2x (3 GR 32 GR 28 GR 2 y = 3x (3 GR 40 GR 54 GR 3.25 While lines of y = x (2 most of them have negative gradients y = x GR -2 GR -0.8 GR 4 y = 2x (2 GR -14 GR -3 GR 13 y = 3x (2 GR -45 GR 33 GR 27.5 Formula: The formula is gr = a Conclusion: I have found out that gradients increase when the line is made bigger. Also I have commented on different observations I have

The Gradient Function
The Gradient Function Part 1 We have been told to investigate the Gradient Function for the set of graphs: y=axn Where a and n are constants. One way to find out the gradient, is to do what I have done for the curve of y=x2. After drawing the tangent of a specific point of x, you draw a triangle, with the x value in the middle of a line on the tangent. You then find the change in y, and the change in x. You then have to apply them to the following formula: The Change in Y The Change in X You simply have to divide the change in y, by the change in x. On all my graphs, there will be small triangles that have been measured out on the tangent. They will be marked with the letters A, B, and C. The line of the triangle running in parallel with the 'y axis' is The Change in Y. The line of the triangle running in parallel with the 'x axis' is The Change in X. This will give you the gradient. However, this is quite an inaccurate method of working out the gradient. This is because if you draw the co-ordinates for the triangle incorrectly, then it will alter the answer that you will discover. There is also the small increment method that you can apply to the curve. I will go into this in a later graph, as well as using this method to work out the gradient. Firstly, I thought that the best thing to do, would be to investigate the graph of y = x2. Below I have drawn a table of
The Gradient Function Maths Investigation
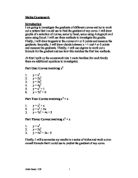
The Gradient Function Introduction A lot of graphs produce lines that are curves. Some of the curves are steep, and some are not. In this investigation I will be looking to work out a formula, which will work out the gradient of any curve. There are three methods for working out the gradient of a curve, all of them using a tangent: > The Tangent Method > The Increment method > General Proof This is the graph of y=x(. I will find out the gradient of this curve, by using the three methods I mentioned above. I will use the point x=2 for this graph. Tangent Method: The tangent method is already shown on the graph. I have drawn a line which touches the edge of the curve, when x=2. Once I have drawn the line I then turn it into a triangle, and look at the change in y, and the change in x. Finally I use the formula: GRADIENT= VERTICAL (CHANGE IN Y AXIS) HORIZONTAL (CHANGE IN X AXIS) Therefore the gradient of the curve equals: The only problem with the tangent method, is that it is only an estimation. Increment Method: The increment method is where you plot two points (P and Q) on the curve, and the draw a line to join them. This is once again illustrated on the graph. Once again I have taken the point x=2. I first get the co-ordinates for both points, in this case P(2,2() and Q(3,3(). After this I then used the formula: y2 - x2 y1 - x1 Therefore I get: 3( - 2( 3
I am going to investigate the gradients of different curves and try to work out a pattern that I could use to find the gradient of any curve.
Maths Coursework Introduction I am going to investigate the gradients of different curves and try to work out a pattern that I could use to find the gradient of any curve. I will draw graphs of a selection of curves, some by hand, some using Autograph and some using Excel. I will use three methods to investigate the graphs. Firstly, I will draw tangents to the curves at 4 or 5 points and measure the gradients. Secondly, I will draw chords between x = 1 and 4 or 5 points and measure the gradients. Thirdly, I will use algebra to work out a formula for the gradient and see how this matches the first two methods. At first I split up the coursework into 3 main families (for each family there are additional equations to investigate): Part One: Curves involving x2 . y = x2 2. y = 2x2 3. y = 3x2 4. y = 4x2 5. y = x2 + 1 6. y = 7x2 + 6 Part Two: Curves involving x2 + x . y = x2 + x 2. y = x2 + 2x 3. y = 7x2 + 4x + 5 Part Three: Curves involving x3 + x . y = x3 2. y = 2x3 3. y = 4x3 + 2x - 5 Finally, I will summarise my results in a series of tables and work out an overall formula that I could use to predict the gradient of any curve. PART ONE: CURVES CONTAINING X2 (1) y = x2 I am investigating the changes in gradient for the curve y = x2. To plot the curve, I will use the table of values given below. x 0 2 3 4 5 6 y 0 4 9 6 25 36 I

The Gradient Function Investigation
The Gradient Function Introduction Curves on a graph can be of varying steepnesses. This steepness also varies from point to point on many graphs. The steepness of a curve at a point is called its gradient. There are several methods for calculating the gradient at a certain point on a curve including the 'Tangent Method' and the 'Small Increments Method'. The Tangent Method Calculating the gradient of a straight line is simple. The formula is: Gradient = Change In Y Change In X This formula is demonstrated on Graph A. A curve proves more of a problem as the gradient is constantly changing. To calculate the gradient at a certain point, we must somehow be able to create a straight line from which to calculate this gradient. This can be achieved by drawing a tangent to the curve at the point in question. A tangent is a straight line which touches the curve at one point and one point only. Calculating the gradient of this tangent will give the gradient of the curve at this point. This is illustrated on Graphs B1, C1 and D1. This method is not very accurate though and large discrepancies in gradient can occur. This is because this method involves manually drawing a tangent which will often be drawn incorrectly. Errors in the measurement of changes in Y and X can also occur, even on a very large scale graph. The Small Increments Method This method is more accurate than the

Aim: To find out where the tangent lines at the average of any two roots intersect the curve again in cubic functions. Functions with Three Roots
Zeros of Cubic Functions Chun Yu Lai Aim: To find out where the tangent lines at the average of any two roots intersect the curve again in cubic functions. Functions with Three Roots *The first example is the function taken from the task sheet. There will be detailed explanation on my working steps, and the rest of the investigation will follow up the same format. Example 1- (The first derivative of the original function will allow me to find out the slope value, "m" at any given x value) Roots = -3, -1.5, 1.5 (I found out the roots of the function by using the graph calculator) . Roots -3 & -1.5 (Two roots are taken at a time to find out where the tangent line at the average of these two roots intersects the original cubic function again. Same steps will be taken, but with other combination pair of roots to prove that my observations apply to any random pair of roots) Average of the two roots = (Their average value, "-2.25" is the x value of the original function, and the task is simply asking for where the tangent line intersects the cubic function when the tangent point is at "x=-2.25". Before finding the function for the tangent line, we will need to first find its "y" value, simply by substituting the value "-2.25" into the original function, f(x).The slope of the tangent line is also required to find out its linear function, and we can do this by
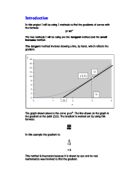
In this project I will be using 2 methods to find the gradients of curves with the formula: y=axn
Introduction In this project I will be using 2 methods to find the gradients of curves with the formula: y=axn The two methods I will be using are the tangent method and the small increase method. The tangent method involves drawing a line, by hand, which reflects the gradient. The graph shown above is the curve y=x2. The line drawn on the graph is the gradient at the point (3,9). The Gradient is worked out by using this formula: QN MN In this example the gradient is: 9 .5 = 6 This method is inaccurate because it is drawn by eye and no real mathematics was involved to find the gradient. The small increase method is a more precise method of finding the gradient of a curve. It uses 2 points on the same curve, which are very close to each other, and uses the straight line between the points as the tangent. As this increase becomes gradually smaller, the line reflects the gradient more and more. Graph --> y=3x3 Small increase method Fixed point A (1,3) B1 = (1.1,3.993) B2 = (1.01,3.090903) B3 = (1.01,3.009009003) AB1 Gradient = 3.993-3 1.1-1 = 0.993 0.1 = 9.93 AB2 Gradient = 3.090903-3 1.01-1 = 0.090903 0.01 = 9.0903 AB3 Gradient = 3.009009003-3 0.001 = 0.009009003 0.001 = 9.009003 The Gradient is approaching 9 Graph --> y=3x3 Small increase method Fixed point A= (2,24) B1= (2.01,24.361803) B2= (2.001,24.036018) B3= (2.0001,24.00360018)

Investigating the Gradients of the Graph of the Form ‘y=x2’
Investigating the Gradients of the Graph of the Form 'y=x2' Aim To find a formula for the gradient of the graph 'y=x2'. To do this I will draw the graph and measure the gradient at certain whole numbers of 'x'. I will take measurements at: x=1, -1, 2, -3 and 5. Graph Table y=x2 x -5 -4 -3 -2 -1 0 1 2 3 4 5 y 25 16 9 4 1 0 1 4 9 16 25 Calculations To find the gradient on a certain point of the 'y=x2' graph you draw a tangent from a point. Then you form a right-angled triangle on the tangent and find the gradient as for the 'y=ax' graph. (As shown on graph) e.g. 9 9-4= 5 4 2 3-2= 1 3 gradient=y/x =5/1 GRADIENT=5 Results x y Gradient -3 -1 1 2 5 9 1 1 4 25 From these results I believe it is possible to deduce that the gradient of the curve at any point is equal to '2x'. Conclusions I belief that that the gradient function for a 'y=x2' graph is 2x. To test this theory I will try it with 1.5 as the value of 'x'. Results II x y Gradient 1.5 2.25 Conclusions II I can now conclude that the gradient function for a graph of the form 'y=x2' is 2x. G.F. =

Tangents and normals.
Tangents and normals If you differentiate the equation of a curve, you will get a formula for the gradient of the curve. Before you learnt calculus, you would have found the gradient of a curve by drawing a tangent to the curve and measuring the gradient of this. This is because the gradient of a curve at a point is equal to the gradient of the tangent at that point. Example: Find the equation of the tangent to the curve y = x³ at the point (2, 8). dy = 3x² dx Gradient of tangent when x = 2 is 3×2² = 12. From the coordinate geometry section, the equation of the tangent is therefore: y - 8 = 12(x - 2) so y = 12x - 16 You may also be asked to find the gradient of the normal to the curve. The normal to the curve is the line perpendicular (at right angles) to the tangent to the curve at that point. Remember, if two lines are perpendicular, the product of their gradients is -1. So if the gradient of the tangent at the point (2, 8) of the curve y = x³ is 8, the gradient of the normal is -1/8, since -1/8 × 8 = -1. Integration Introduction Integration is the reverse of differentiation. If y = 2x + 3, dy/dx = 2 If y = 2x + 5, dy/dx = 2 If y = 2x, dy/dx = 2 So the integral of 2 can be 2x + 3, 2x + 5, 2x, etc. For this reason, when we integrate, we have to add a constant. So the integral of 2 is 2x + c, where c is a constant. A 'S' shaped symbol is used