The Gradient Function Coursework
The Gradient Function Coursework In this piece of coursework I am going to do research on the gradient of various graphs at various points, in order to find a function, which will determine the gradient of these points without drawing or using approximations. I will only need to know the coordinates of the point as well as the type of graph I am considering, to submit them into the gradient function and determine the gradient at this point. The formulae I will use and produce will have particular parameters. Now I am going to explain them. a: this letter will stand for the coefficient of x in the function y=ax^n and determines how steep the graph will be. n: this letter will be the power to which x is raised in the function y=ax^n and determines the shape of the graph. m: this letter will stand for the gradient at any point of any graph. I can say for example the gradient at the point P(1;1) of the graph y=x is 1. Therefore here m=1. The first range of graphs I am going to investigate will have the function y=ax. I will draw three graphs on the next pages and hope to see a pattern between the gradient and the function of the graphs. I do not need to consider the coordinates of the points at which I will determine the gradient, as the gradient is the same at any point on the graph y=ax. From these three graphs I clearly recognise a pattern. I will show how I noticed
Gradient Function
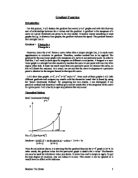
Gradient Function Introduction For this project, I will deduce the gradient for several y=axn graphs and with this find any sort of relationships between the x values and the gradient. A gradient is the steepness of a curve at a point. Gradients can prove to be very useful. It usually means something in most graphs for e.g. in distance-time graphs, the gradient indicates the speed. The gradient formula for a straight line is: Gradient = Change in y Change in x However, since the y=axn forms a curve rather than a simple straight line, it is much more apprehensive to calculate its gradient. Therefore, another method has to be applied. The gradient for the non-linear graph is the steepness of a curve at one particular point. In order to find this, I will need to draw specific tangents on different x-axis points. A tangent in a non-linear graph is a straight line that essentially touches the curve at one point with two tiny alike angles either side. It must not touch more than one particular point or intersect the curve, as this will distort the outcome. As a result, we can say that the curve's steepness at a particular point is identical to the tangent formed in that specific curve. I will draw four graphs: y=x2, y=x3 y=2x2 and y=x-1. From each of these graphs I will infer different gradients and compare my results with the theoretical result that is found by using the

Graphical Maths Project
Year 11 Graphical Maths project The aim of this project is to be able to create a system for understanding the relationship between the gradients of tangents of curves. Unlike straight lines, curves cannot have a single gradient that applies to the whole curve, but there are an infinite number of straight lines that can touch the curve at one point. There is only one perfect tangent line for each point on a curve, and all of these tangent lines have different gradients. It is the relationship between these gradients that will be explored in the first part of this investigation. The first task to be carried out was to find several perfect tangents of the graph y=x2. This presented a challenge, as there is no easy way to discover lines that are perfect tangents of a curve. In my first attempt, I created a line in autograph and gradually changed the y intercept parameters in an attempt to "move" the line into position as a tangent of the graph y=x2. This proved time consuming and ineffective however, as the following screenshots show; Here the blue line appears to cross the red line at y=0.25, x=0.45, but this is unclear because of the distance from the point. Further zooming reinforces the possibility that the line could be an exact tangent. Further zooming still makes the possibility of a potential discovery significantly less likely; however, when even more zooming takes
I have been given the equation y = axn to investigate the gradient function for varied values of "a" and "n".
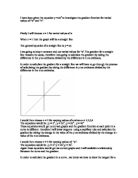
I have been given the equation y = axn to investigate the gradient function for varied values of "a" and "n" Firstly I will choose n = 1 for varied values of a When n = 1 then the graph will be a straight line The general equation of a straight line is y = ax I am going to keep n constant and use varied values for "a".The gradient for a straight line remains the same, therefore I am going to calculate the gradient by taking the difference in the y co-ordinates divided by the difference in x co-ordinates. In order to calculate the gradient for a straight line we will have to go through the process of calculating the gradient by taking the difference in y co-ordinates divided by the difference in the x co-ordinates. I would then choose n = 2 for varying values of a where a = 1,2,3,4 The equations would be ; y = x2 , y = 2x2 , y = 3x2 , y = 4x2 These equations would get us curved graphs and the gradient function at each point in a curve is different therefore I will draw tangents using a capillary tube and calculate the gradient by taking the change in the value of the y co ordinates divided by the change in t value of the x co ordinates. I would then choose n = 3 for varying values of "a". The equations would be ; y = x3, y = 2x3,y = 3x3. Again these equations would get me curved graphs and I will establish a relationship Between the curve and the

The Gradient Function.
The Gradient Function I am trying to find a formula that will work out the gradient of any line (the gradient function) I am going to start with the simplest cases, e.g. y=x² as they are probably going to be the easiest equations to solve as they are likely to be less complex and hopefully the formulas to the more complex equations will be easier to discover by looking at the previous formulas. I am going to look at the line y=x² first. y=x² X 2 3 4 y 4 9 6 One of the most obvious things I notice is that as the co-ordinates increase so does the gradient. Not only can you see that from the results below, but also on the graph you can that the line gets steeper and steeper. This makes sense as the higher the number x is the larger the difference between x² and x. Another thing that I have noticed is that the larger the co-ordinates the smaller the increase in gradient. Point Gradient (tangent) Gradient (Small Increment Method) (1,1) 2 2.01 (2,4) 3.3 3.01 (3,9) 6.36 (2dp) 6.01 (3.5,12.3) 6.4 7.001 As the table above shows there are two methods that I am using for calculating the gradient of line. The first being drawing a tangent at the point, working out the distances on the tangent using the scale on the graph and then using this formula: dy/dx However there is another way called small increment method. This method gives a more
In this piece of coursework I will investigate the gradient function.
Victoria Jennings- 11SEG GCSE Mathematics Coursework 2003 The Gradient Function In this piece of coursework I will investigate the gradient function. The "steepness" of a curve is measured by its gradient. The gradient of a curve at a particular point is defined as the gradient of the tangent drawn to the curve at that point. The gradient at a point on any curve is defined as the gradient function. I will carry out this investigation using the equation: y = axn I am trying to find a formula that will work out the gradient of any line. ...................................................................................................... We can use the "tangent method" to obtain the gradients of graphs of different functions. I am going to look at y=x1 first because it is the easiest. See graph A y -4 -3 -2 -1 0 2 3 4 x -4 -3 -2 -1 0 2 3 4 As we see, the gradients of y=x is very simple, g=1. We even do not need to draw any tangents to obtain the gradients. So the relationship between g and x can be shown in the table below: x g (gradient) -4 -3 -2 -1 0 2 3 4 So it is obvious that in the graph of y=x, whatever x is, the gradient, g stays 1. ...................................................................................................... I will now look at the graph of y=x2. See graph B By drawing the tangents of each point, we can
For this investigation, I have to find the relationship between a point of any non-linear graph and the gradient of the tangent, which is the gradient function.
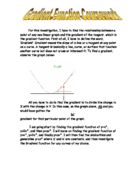
For this investigation, I have to find the relationship between a point of any non-linear graph and the gradient of the tangent, which is the gradient function. First of all, I have to define the word, 'Gradient'. Gradient means the slope of a line or a tangent at any point on a curve. A tangent is basically a line, curve, or surface that touches another curve but does not cross or intersect it. To find a gradient, observe the graph below: All you have to do to find the gradient is to divide the change in X with the change in Y. In this case, on the graph above, AB and you would have gotten the BC gradient for that particular point of the graph. I am going start by finding the gradient function of y=x², y=2x², and then y=ax². I will move on finding the gradient function of y=x³, y=2x³, and finally y=ax³. I will then find the similarities and generalise y=axn where 'a' and 'n' are constants, and then investigate the Gradient function for any curves of my choice. I will first find the gradient of tangents on the graph y=x² by drawing the graph (page 3), and then find the gradient for a number of selected points on the graph: Point X Change in Y Change in X Gradient a -3 6 -1 -6 b -2 4 -1 -4 c -1 2 -1 -2 d 2 2 e 2 4 4 f 3 6 6 As you can see, the gradient is always twice the value of its original X value Where y=x². So the
The Gradient Function - Aim: to investigate the gradient function for all kinds of curves.
Mathematics Coursework The Gradient Function Aim: to investigate the gradient function for all kinds of curves. Research: What does "gradient" mean? Generally, the "steepness" of a curve is measured by its gradient. We can look at the figure below: This is the curve of y=x2. The point P (3, 9) has been marked and the tangent QPM drawn. The gradient of the tangent is QN/MN. So we can use the "tangent method" to obtain the gradients of graphs of different functions. First Step: I am going to investigate the gradient of y=x, y=x2, y=x3 first because they are likely to be the simplest equations to solve, and after getting these results easily, by looking at them, the more complex equations will seem easier to discover. I am going to look at y=x first because it is the easiest. x 2 3 4 y 2 3 4 Please see graph on separate pieces of paper As we see, the gradients of y=x is very simple, g=1. We even do not need to draw any tangents to obtain the gradients. So the relationship between g and x can be shown in the table below: x g (The Gradient) 2 3 4 So it is extremely obvious that in the graph of y=x, whatever x is, the gradient g stays 1. Then let us try the graph of y=x2. x 2 3 4 y 4 9 6 By drawing the tangents of each point, we can calculate the gradients. However, as the graph is not always accurately drawn, there must be some error between the
Algrebra:Gatwick airport temperatures
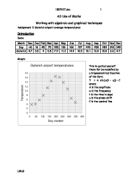
AS Use of Maths Working with algebraic and graphical techniques Assignment 2: Gatwick airport average temperatures Introduction Data: Graph: This is cyclical and will there for be modelled by a trigonometrical function of the form Y = A sin (?(t + ?)) + C where A is the amplitude ? is the frequency t is the time in days ? is the phase shift C is the central line Finding the model The central line is: (min + max)/2 = (3.8+16.5)/2 = 10.15 The amplitude is: (max - min)/2 = (16.5-3.8)/2 = 6.35 The frequency: 360/period(cycle length) = 360/365 = 0.986 This gives a first model of y = 6.35snin (0.986t) + 10.15 The initial estimate for the phase shift was 110 to the right, so by translation t --> (t - 110). This result was not on the original data, but further modifications gave rise to t --> ( t -113) which appeared closest. On checking the values for the average absolute error for the points given by the data, this also gave the smallest error. So y = 6.35snin (0.986(t - 113)) + 10.15 is the model for the data Checking the model works The data give (197, 16.5) When t = 197, the model gives y = 6.6 sin (0.986(197 - 113)) + 10.2 y = 6.6 sin (82.824)+10.2 = 6.6 x 0.992 + 10.2 = 16.75 is very close to the data value of 16.7, so the model works Applications of the model . Finding the rate of change of the temperature To find the approximate

Gradient Fucntion
The Gradient Function In this coursework I am going to try and find out what the gradient function is for various curved graphs. I will do this by drawing graphs and find the gradient of the tangent of a point. . I am going to draw a graph of y=x². I will use values from 0-5, I will obtain the gradient of the tangent at different points. This is the table of the results of y=x². X 0 2 3 4 5 Y=x² 0 4 9 6 25 This is the results of the gradient of the tangent: Gradient of y=x². At (1,1) .8 .8 = 2(to 1sf) At (2.4) 2 0.5 4 At (3,9) 4.7 0.8 5.875 = 6(to 1sf) At (4,16) 3 0.3 0 I have noticed that the gradient of the tangent doubles each time. Except for at (4,16) so I fink that this is an anomalious result, which would mean that the tangent must be drawn incorrectly. I am now going to draw a graph of y=x³. I will use values from 0-5, I will obtain the gradient of the tangent at different points. This is the table of the results of y=x³. X 0 2 3 4 5 Y=x³ 0 8 27 64 25 This is the results of the gradient of the tangent: Gradient of y=x³. At (1,1) 3 0.9 3.33333 = 3(to 1sf) At (2.8) 5 .3 1.538462 = 12(to 1sf) At (3,27) 20 0.8 25 At (4,64) 22 0.5 44 I haven't noticed a pattern in this set of results, but I think that at (3,27) and (4,64), my gradients are a bit wrong. I think it is that the second difference goes