Graphical Maths Project
Year 11 Graphical Maths project The aim of this project is to be able to create a system for understanding the relationship between the gradients of tangents of curves. Unlike straight lines, curves cannot have a single gradient that applies to the whole curve, but there are an infinite number of straight lines that can touch the curve at one point. There is only one perfect tangent line for each point on a curve, and all of these tangent lines have different gradients. It is the relationship between these gradients that will be explored in the first part of this investigation. The first task to be carried out was to find several perfect tangents of the graph y=x2. This presented a challenge, as there is no easy way to discover lines that are perfect tangents of a curve. In my first attempt, I created a line in autograph and gradually changed the y intercept parameters in an attempt to "move" the line into position as a tangent of the graph y=x2. This proved time consuming and ineffective however, as the following screenshots show; Here the blue line appears to cross the red line at y=0.25, x=0.45, but this is unclear because of the distance from the point. Further zooming reinforces the possibility that the line could be an exact tangent. Further zooming still makes the possibility of a potential discovery significantly less likely; however, when even more zooming takes
Number grids. In this investigation I have been attempting to work out a formula that will find the difference between the products of the top left and bottom right of a number grid and the top right and bottom left of a number grid.
2 3 4 5 6 7 8 9 0 1 2 3 4 5 6 7 8 9 20 21 22 23 24 25 26 27 28 29 30 31 32 33 34 35 36 37 38 39 40 41 42 43 44 45 46 47 48 49 50 51 52 53 54 55 56 57 58 59 60 61 62 63 64 65 66 67 68 69 70 71 72 73 74 75 76 77 78 79 80 81 82 83 84 85 86 87 88 89 90 91 92 93 94 95 96 97 98 99 00 2 3 4 5 6 7 8 9 0 1 2 3 4 5 6 7 8 9 20 21 22 23 24 25 26 27 28 29 30 31 32 33 34 35 36 37 38 39 40 41 42 43 44 45 46 47 48 49 50 51 52 53 54 55 56 57 58 59 60 61 62 63 64 65 66 67 68 69 70 71 72 73 74 75 76 77 78 79 80 81 In this investigation I have been attempting to work out a formula that will find the difference between the products of the top left and bottom right of a number grid and the top right and bottom left of a number grid. 2 3 4 5 6 7 8 9 0 1 2 3 4 5 6 7 8 9 20 21 22 23 24 25 26 27 28 29 30 31 32 33 34 35 36 37 38 39 40 41 42 43 44 45 46 47 48 49 50 51 52 53 54 55 56 57 58 59 60 61 62 63 64 65 66 67 68 69 70 71 72 73 74 75 76 77 78 79 80 81 82 83 84 85 86 87 88 89 90 91 92 93 94 95 96 97 98 99 00 A 10x10 number grid If you choose any 2x2 box on a 10x10 number grid then the difference should equal 10...

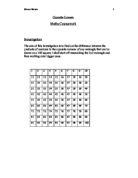
I am going to investigate the difference between the products of the numbers in the opposite corners of any rectangle that can be drawn on a 100 square (10x10) grid
Opposite Corners Opposite Corners * Throughout this piece of work, the horizontal side will be referred to as the length, whilst the vertical side will be referred to as width. Introduction/Aim I am going to investigate the difference between the products of the numbers in the opposite corners of any rectangle that can be drawn on a 100 square (10x10) grid. I am going to investigate different rectangles, of different areas, lengths, widths and positioning on a grid. After finding a pattern, I will try and prove that it will work for other cases by using algebra and making an algebraic formula. As I go along, I will have to record any ideas I have or patterns I see. Afterwards, I will go on to investigate how this rule may differs on a different sized grid. 2x2 Square, 10x10 Grid 2 3 4 5 6 7 8 9 10 11 12 13 14 15 16 17 18 19 20 21 22 23 24 25 26 27 28 29 30 31 32 33 34 35 36 37 38 39 40 41 42 43 44 45 46 47 48 49 50 51 52 53 54 55 56 57 58 59 60 61 62 63 64 65 66 67 68 69 70 71 72 73 74 75 76 77 78 79 80 81 82 83 84 85 86 87 88 89 90 91 92 93 94 95 96 97 98 99 100 This is a 10x10 grid. On it (outlines in red) is a 2x2 square. Firstly, I’m going to see what the difference between the products of the corners is (D): 55x64=3520 54x65= 3510 3520-3510=10, D=10 Now: What

In this piece course work I am going to investigate opposite corners in grids
Mathematics Course Work Opposite Corners Introduction In this piece course work I am going to investigate opposite corners in grids. I will start by investigating a 7x7 grid. Within this grid I will use 2x2, 3x3, 4x4, 5x5, 6x6 and a 7x7 grid. I will do this to find whether I can find a pattern. I will do this by multiplying the two opposite corners together then subtracting them. I will try to find the patterns and do a formula that will work for all grid sizes and shapes. I will experiment shapes and sizes of all different grids. Prediction I predict that in a 7x7 grid all the opposite corners will be a multiple of 7 and in an 8x8 grid they will be a multiple of 8 and so on. They will only do this if I multiply the two opposite corners then subtract the two from each other. To check my hypothesis I will use 6x6, 7x7, 8x8 and maybe if I have time I will do a 9x9 and 10x10 grid. Also I will be looking at all different shapes and sizes. I hope to find a formula for all grids and all shapes and sizes. 7x7 Grid Here is a grid of numbers in sevens. It is called a seven grid. In this section I will multiply the opposite corners and then subtract them. 2x2 2 3 4 5 6 7 8 9 0 1 2 3 4 5 6 7 8 9 20 21 22 23 24 25 26 27 28 29 30 31 32 33 34 35 36 37 38 39 40 41 42 43 44 45 46 47 48 49 In my 7x7 grid I have highlighted three 2x2
Frogs Investigation - look at your results and try to find a formula which gives the least number of moves needed for any number of discs x .It may help if you can count the number of hops and slides separately .
Name: Maame Yaa Buckman Date: 14th February 2008 Subject: Mathematics Project title: Frogs Submitted to: Mr. John Essuman (Mathematics Department) Content Page Introduction to frogs Page 3 Example of the game Page 4 Question 1 Pages 5&6 Question 2 Pages 7, 8&9 Question 3 Pages 10, 11, 12&13 Formula 1 Page 14 Question 4 Page 15 Question 5 Pages 16&17 Question 6 Pages 18, 19 &20 Question 7 Pages 21, 22, 23&24 Formula Page 25 Conclusion Page 26 This was a game invented by the French mathematician called Lucas .He named it Frogs. The Aim of The Game To gain success in this interesting game you need to swap the positions of the disc so that they end up the opposite way around. (With a space in the middle) The rules are as follows: . A disc can slide over one square in either direction onto an empty square. 2. A disc can hop over one adjacent disc of the other color provided it can land on an empty square. Take a look at this example A) Slide one square to the right. B) Hops over to the left. C) Slide one square to the right.
In this coursework, I intend to investigate the differences of the products of the diagonally opposite corners of a rectangle, drawn on a 10x10 grid, with the squares numbered off 1 to 100
Opposite Corners Introduction In this coursework, I intend to investigate the differences of the products of the diagonally opposite corners of a rectangle, drawn on a 10x10 grid, with the squares numbered off 1 to 100. I will aim to investigate the differences for rectangles that are aligned differently, of different lengths and widths. Hypothesis This coursework will aim to establish if there is a pattern from which we could derive a formula from the numbers in the grid. Plan The plan is to use Algebra to analyse the results which will be logged into tables. Subsequently I will test any rules, patterns and theories I find by using predictions and examples. Methodology To start with I will break up my work into sections, my first is: 2x3 Rectangles I will concentrate on one particular aspect at a time. What is the difference between the products of the corners? Is the difference the same for a rectangle drawn anywhere in the grid? I now have several questions: Is the difference different when the rectangle is aligned so that its shortest sides are at the top and bottom? What is the same between the two alignments? What About Other Sizes of Rectangles? I will now try rectangles, all in the 2 x X series, with different lengths. I think I can now safely assume that the difference is always constant in relation to the size of the rectangle, therefore I only
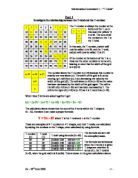
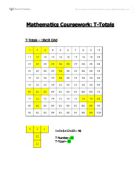
T-total coursework
Part 1 Investigate the relationship between the T-total and the T-number 2 3 4 5 6 7 8 9 0 1 2 3 4 5 6 7 8 9 20 21 22 23 24 25 26 27 28 29 30 31 32 33 34 35 36 37 38 39 40 41 42 43 44 45 46 47 48 49 50 51 52 53 54 55 56 57 58 59 60 61 62 63 64 65 66 67 68 69 70 71 72 73 74 75 76 77 78 79 80 81 2 3 0 1 2 9 20 21 The T-number is always the number at the bottom of the T, so in this case (the yellow T) it is 20. The sum of all the numbers in the T is the T-total. In this case, the T-number, (which will now be called n) is 20, and the T-total, (which will now be called T) is 37. If the number at the bottom of the T is n, these are the other numbers in terms of n, bearing in mind that the width of the grid is 9 (by 9): n-19 n-18 n-17 0 n-9 2 9 n 21 The number above the T-number is (n-9) because this number is exactly one row above (n). The width of the grid is 9, so by moving up 1 cell from (n), I am decreasing the value by the width of the grid (9). The cell above (n-9) is (n-18) as the value has been decreased by the width of the grid again. The cell to the left of (n-18) is (n-19) as it has been decreased by 1. The cell to the right of (n-18) is (n-17) as it is 1 more than (n-18). When these 5 terms are added together I get: (n) + (n-9) + (n-17) + (n-18) + (n-19) = 5n - 63
Gradient Function
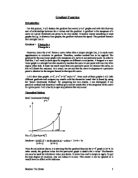
Gradient Function Introduction For this project, I will deduce the gradient for several y=axn graphs and with this find any sort of relationships between the x values and the gradient. A gradient is the steepness of a curve at a point. Gradients can prove to be very useful. It usually means something in most graphs for e.g. in distance-time graphs, the gradient indicates the speed. The gradient formula for a straight line is: Gradient = Change in y Change in x However, since the y=axn forms a curve rather than a simple straight line, it is much more apprehensive to calculate its gradient. Therefore, another method has to be applied. The gradient for the non-linear graph is the steepness of a curve at one particular point. In order to find this, I will need to draw specific tangents on different x-axis points. A tangent in a non-linear graph is a straight line that essentially touches the curve at one point with two tiny alike angles either side. It must not touch more than one particular point or intersect the curve, as this will distort the outcome. As a result, we can say that the curve's steepness at a particular point is identical to the tangent formed in that specific curve. I will draw four graphs: y=x2, y=x3 y=2x2 and y=x-1. From each of these graphs I will infer different gradients and compare my results with the theoretical result that is found by using the
Opposite Corners
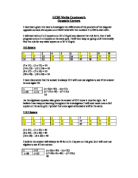
Opposite Corners Maths Coursework Investigation The aim of this investigation is to find out the difference between the products of numbers in the opposite corners of any rectangle that can be drawn on a 100 square. I shall start off researching the 2x3 rectangle and then working onto bigger ones. 2 3 4 5 6 7 8 9 0 1 2 3 4 5 6 7 8 9 20 21 22 23 24 25 26 27 28 29 30 31 32 33 34 35 36 37 38 39 40 41 42 43 44 45 46 47 48 49 50 51 52 53 54 55 56 57 58 59 60 61 62 63 64 65 66 67 68 69 70 71 72 73 74 75 76 77 78 79 80 81 82 83 84 85 86 87 88 89 90 91 92 93 94 95 96 97 98 99 00 2x3 Rectangle 7 8 9 7 8 9 2 3 1 2 3 88 89 90 98 99 00 x13=13 88x100=8800 7x19=133 1x3=33 98x90=8820 17x9=153 20 20 20 Prediction I predict that when I multiply a 2x3 rectangle the opposite corners will have a difference of 20. 2x2 Rectangle (square) 72 73 82 83 4 5 4 5 33 34 43 44 4x15=60 33x44=1452

opposite corners
Maths Coursework: Opposite Corners Opposite Corners: Introduction: My algebra coursework is about opposite corners in a square in a number grid. The top right and the bottom left numbers are multiplied and the same is done with the top left and bottom right numbers. The difference is calculated between the 2 products and the answer is used to find a pattern. The size of the square will be changed, 2x2, 3x3 and 4x4, to see whether the answers left will help to determine whether or not there is a pattern. 0x10 Grid: I am starting off by using a 10x10 and within this grid I will outline 2x2 squares, 3x3 squares and 4x4 squares. With these squares I will work out the opposite corners in order to see whether or not there is a pattern. 2 3 4 5 6 7 8 9 0 1 2 3 4 5 6 7 8 9 20 21 22 23 24 25 26 27 28 29 30 31 32 33 34 35 36 37 38 39 40 41 42 43 44 45 46 47 48 49 50 51 52 53 54 55 56 57 58 59 60 61 62 63 64 65 66 67 68 69 70 71 72 73 74 75 76 77 78 79 80 81 82 83 84 85 86 87 88 89 90 91 92 93 94 95 96 97 98 99 00 2x2 Squares: 2 3 4 5 6 7 8 9 0 1 2 3 4 5 6 7 8 9 20 21 22 23 24 25 26 27 28 29 30 31 32 33 34 35 36 37 38 39 40 41 42 43 44 45 46 47 48 49 50 51 52 53 54 55 56 57 58 59 60 61 62 63 64 65 66 67 68 69 70