The amplitude is: (max – min)/2 = (16.5-3.8)/2 = 6.35
The frequency: 360/period(cycle length) = 360/365 = 0.986
This gives a first model of y = 6.35snin (0.986t) + 10.15
The initial estimate for the phase shift was 110 to the right,
so by translation t → (t – 110). This result was not on the original data, but further modifications gave rise to t → ( t -113) which appeared closest.
On checking the values for the average absolute error for the points given by the data, this also gave the smallest error.
So y = 6.35snin (0.986(t – 113)) + 10.15 is the model for the data
Checking the model works
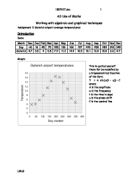
The data give (197, 16.5)
When t = 197, the model gives
y = 6.6 sin (0.986(197 – 113)) + 10.2
y = 6.6 sin (82.824)+10.2 = 6.6 x 0.992 + 10.2 = 16.75 is very close to the data value of 16.7, so the model works
Applications of the model
Finding the rate of change of the temperature
To find the approximate gradient at a point, use the model to find the values of 2 points one either side of the point required that are very close to the place where the gradient is needed. By finding the gradient between these 2 points, the answer will be very close to the gradient of the tangent
To find an approximation to the gradient at t = 100, find the coordinates of t = 99.99 and 100.01
At t = 99.99 y = 8.7402
at t = 100.01, y = 8.7423
So the gradient = (8.7423 - 8.7402)/( 100.01 - 99.99) = 0.0019/0.02 = 0.095 or 0.1
In context this shows that at t = 100 (early April) the temperature is rising about 0.10 C per day
Finding the day on which the temperature reaches a given value
If the central heating is turned off when the average daily temperature reaches 100C, when will that be:
For y = 6.35snin (0.986(t – 113)) + 10.15, when y = 10 then
10 = 6.35 sin (0.986(t – 113)) + 10.15
Subtracting 10.15 from both sides
-0.15 = 6.35snin (0.986(t – 113))
Dividing both sides by 6.35
-0.15/6.35 = -0.024 = sin (0.986(t – 113))
Taking the inverse sine of both sides
sin-1(-0.024) = (0.986(t – 113))
-1.35 = 0.986(t – 113)
Divide by 0.986 -1.35/0.986 = -1.3692 = t – 113
Add 113 -1.3692 + 113 = 111. 63 = t
This means on the day which is the heating will be turned off is 112 day which is 22 April
Evaluation and conclusion
The model works well in mirroring the data. Unless climate change really increases, it is likely that this model will be useful for some years to come