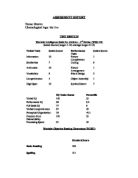
NARA II measures the rate, comprehension and accuracy of reading. Ebrahim’s Accuracy and Rate standard scores were both 108 at the 70th centile, therefore his scores are higher than 70 out of the 100 children in the standardised sample giving him a fairly higher than average score. However, Ebrahim’s Comprehension standard score was below average as he got 84 at the 14th centile. WOLD measured Ebrahim’s listening comprehension, where he obtained a standard score of 84 at the 14th centile, which is once again, below average.
Ebrahim’s Verbal IQ was significantly higher than his Performance IQ, therefore showing a major discrepancy between the two. Ebrahim’s Verbal Comprehension Index score is significantly higher than his Perceptual Organisation score, suggesting that his strength lies in understanding verbal information, thinking and reasoning with words, and expressing thoughts as words (verbal communication) but has a major weakness in tasks that require him to examine and think about tasks including designs and pictures, and in solving problems without using words (non-verbal communication). Ebrahim’s Perceptual Organisation index score was significantly lower than his Processing Speed index score and implies he performs better on tasks requiring him to quickly scan and make judgments. These tasks measure his skills in speed of mental problem-solving, attention, and eye-hand coordination. His Verbal Comprehension index score, Perceptual Organisation index score and Processing Speed index score were all significantly lower than his Freedom from Distractibility index score; the Freedom from Distractibility index measures working memory and demonstrates that Ebrahim has a greater understanding of tasks requiring him to learn and retain information in memory whilst utilising the learned information to complete a task. The tasks that are entailed in this index measure his skills in attention, concentration, and mental reasoning.
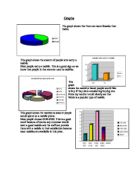
Differences between individual subtest scores and average scaled scores for 12 tests and for 6 tests were calculated in order to check statistical significance and the cumulative percentages of the standardisation sample obtaining discrepancies of the size observed. This provides information on how unusual discrepancies of the observed magnitude are. Ebrahim’s average scaled score for 12 tests was 5.75, his Information and Arithmetic subtest scores were significantly higher than his average scaled score, the difference between Ebrahim’s subtest scores and his average scaled score is greater than the difference obtained by 5% of the standardisation sample. This difference is unusual at it means less than 5% of the school population would be expected to show such a large discrepancy between their Information/Arithmetic subtest scores and their average scaled score. Ebrahim’s Vocabulary and Digit Span subtest scores were significantly higher than his average scaled score, the difference between Ebrahim’s subtest scores and his average scaled score is greater than the difference obtained by 25% of the standardisation sample. This difference isn’t very rare as it means up to 25% of the school population would be expected to show such a large discrepancy. His Picture Completion subtest score was significantly lower than his average scaled score, the difference between Ebrahim’s subtest score and his average scaled score is greater than the difference obtained by 5% of the standardisation sample, therefore the difference is unusual as it means less than 5% of the school population would be expected to show such a large discrepancy. His Picture Arrangement and Block Design subtest scores were significantly lower than his average scaled score, the difference between Ebrahim’s subtest scores and his average scaled score is greater than the difference obtained by 25% of the standardisation sample, therefore the difference isn’t unusual as it means less than 25% of the school population would be expected to show such a large discrepancy. His Object Assembly subtest score was significantly lower than his average scaled score, the difference between Ebrahim’s subtest score and his average scaled score is greater than the difference obtained by 10% of the standardisation sample, therefore the difference is fairly uncommon as it means less than 10% of the school population would be expected to show such a large discrepancy.
Since there was a significant discrepancy between Verbal and Performance IQs differences between individual subtest scores and average scaled scores for 6 tests were also calculated. His Comprehension subtest score was significantly higher than his Verbal average scaled score, the difference between Ebrahim’s subtest score and his average scaled score is greater than the difference obtained by 25% of the standardisation sample, therefore the difference is not very uncommon as it means less than 25% of the school population would be expected to show such a large discrepancy. Ebrahim’s Symbol Search subtest score was significantly higher than his Verbal average scaled score, the difference between his subtest score and his average scaled score is greater than the difference obtained by 10% of the standardisation sample, therefore the difference is fairly rare as it means less than 10% of the school population would be expected to show such a large discrepancy.
Ebrahim’s WORD standard score results for Basic Reading were significantly better than would be expected, the difference is unusual as only 3% of the school population would be expected to show such a large discrepancy. His standard score for Spelling was also significantly better than would be expected and the difference is very unusual in that only 1-2% of the school population would be expected to show that large a discrepancy between the achieved and predicted scores.
Throughout the administration of the tests Ebrahim’s seemed slightly restless and his concentration somewhat diverted from the concepts of tasks. He sometimes had difficulty understanding the intention of the task, producing obvious and simplistic answers rather than logical ones. For example, in the similarities subtest, he was reminded more than once to look for similarities rather than differences and in the picture completion subtest he had to be encouraged to look for missing items. He also tended to verbalise tasks such as coding, picture arrangement and arithmetic to simplify the task. However, Ebrahim had good speed and verbalisation of words, regardless of whether he understood the context in which they were being used.
Since Ebrahim has suffered from difficulties with motor coordination he may be suffering from a mild case of cerebral palsy or his reaction to food colourings and hyperactivity may suggest ADHD. Much of a child's normal intellectual, physical, and social development occurs through play and exploration of the environment however cerebral palsy or ADHD may restrict a child's ability to engage in these activities, and therefore prevent the acquisition of motor skills, knowledge of the world, and social competence. He should be referred to his GP for further medical examination.
Appendix
Average Scaled Score for 12 subtests = 5.75
Average Scaled score for 6 subtests (Verbal) = 8.5
Average Scaled score for 6 subtests (Performance) = 3