Here we can see that after ‘n’ hours bad tomatoes reach both walls, and the border of bad tomatoes is represented by a thick line on the diagram. However, the whole square extract from a tray is not completely infected yet. Exactly the same time is required for the rest of the extract to go bad. So the time needed for the whole tray extract to go bad becomes:
T = 2n (hours)
Stage two of the analysis
We should now consider a more complicated case of arbitrary position of the first bad tomato. Again a shaded cell represents the initial tomato. The number of rows is represented by ‘m’ and the number of columns to the tray side is represented by ‘n’.
Using the formula given in stage one of the analysis, we can first calculate the time required for half of the ‘n’ sided square to go bad (thick line #1). We will call this time T1 = n. We must now calculate the time required for the area between the two thick border lines to go bad. This is achieved by subtracting ‘n’ from ‘m’. We will call this time T2 = m-n. The uncovered area after the second thick line is all that is left. This is the second half of the square calculated first in this stage of the analysis. We will call this T3 = n. So now we can calculate the time needed for the whole tray extract to go bad (T):
T = T1 + T2 + T3 = n + (m-n) + n = m + n
Therefore the total time required to reach the corner is
If this were the most remote corner from the starting position, it would represent the total time needed for the whole tray to go bad.
Stage three of the analysis
Now we can calculate the time required for a rectangular tray of size M x N to go bad. A shaded cell represents the initial bad tomato.
Applying what we have learned in the previous stage of the analysis, we can firstly calculate the time required for the tomatoes in all four corners going bad, and secondly picking the longest time from these four results. The longest time, therefore will be the total time required for the whole tray to go bad. The formulas for calculating the time the bad tomatoes reach the corners are:
Corner T1 = (Q-1) + (P-1)
Corner T2 = (M-Q) + (P-1)
Corner T3 = (N-P) + (M-Q)
Corner T4 = (Q-1) + (N-P)
So the time needed for the whole tray to go rotten is
Worked example
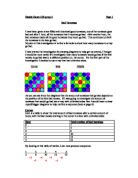
This worked example will answer part 1 of the given investigation. The given tray size 4 by 4 can be seen in the following diagram, where the differently shaded cells are the three distinctively different starting positions. There is no point to consider other starting positions, as they will be similar to either 1,5 or 6 because of the symmetry; 1 is similar to 4, 16 and 13; 5 is similar to 9,8,12,2 and 3; 6 is similar to 7,11,10,14 and 15. They are similar because the lines of symmetry show that the square can be split into eight identical sections.
Using notation from the previous section, and using formulae for the most remote corner from the starting position, we can calculate the time required for the whole tray to gto bad from starting positions 1,5 and 6, and therefore from any other position.
M = 4
N = 4
Tomato 1 is the initial bad tomato:
P = 1
Q = 4
T = T3 = (Q-1) + (N-P) = 3 + 3 = 6
Tomato 5 is the initial bad tomato:
P = 1
Q = 3
T = T3 = (Q-1) + (N-P) = 2 + 3 = 5
Tomato 6 is the initial bad tomato:
P = 2
Q = 3
T = T3 = (Q-1) + (N-P) = 2 + 2 = 4
Average time required for tray to go bad
It would be useful to create a formula, which could calculate the average time required for any tray to go bad. But this is very difficult. So I have come up with a formula which gives an approximate average time required for the tray to go bad. Let us consider a rectangular tray of size N by M.
We can see that from symmetry the rectangle can be split into four smaller equal rectangles, which have repeated starting positions. An example of this can be seen on the previous page where the symmetry repetition is explained with an example. Here we can see that the longest time for the whole tray to go bad would be from point 1 to point 3. The shortest time for the tray to go bad is from point 5 to point 3. So the average time for the tray to go bad corresponds to a starting position between points 1 and 5. I guess that this point must be 6, in the middle of the small rectangle.
We can now calculate the average time required for the whole tray to go bad using the formula obtained in the previous pages assuming that the starting position 6 gives this time. In this situation we have to apply the following formula:
Corner T3 = (N-P) + (M-Q)
Corner T3 = (N- (1/4N)) + (M- (1/4M)) =
This is my formula for calculating the average time required for the whole tray to go bad.
To prove that this formula gives a reasonable idea to the average time required for the tray to go bad, let us consider an example where we can calculate exactly the average time required for the tray to go bad. I will use the square 4 by 4, which can be seen in the previous page. The average time for the tray to go bad is:
Taverage = [(4+5+6)/3] hours = 5 hours
This can be seen easier on the following histogram:
Applying my formula for calculating the approximate average time for the tray to go bad:
Trough average = ¾(M+N) = ¾(4+4) = 6 hours
The result is that the approximate average is close to the true average, different by 16.33%.
I will now investigate this idea with a tray size 5 by 5:
The different times required for the tray to go bad from different starting positions are as follows:
Tomato 1 is the initial bad tomato:
T1=8
Tomato 6 is the initial bad tomato:
T6=7
Tomato 7 is the initial bad tomato:
T7=6
Tomato 11 is the initial bad tomato:
T11=6
Tomato 12 is the initial bad tomato:
T12=5
Tomato 13 is the initial bad tomato:
T13=4
So the average time for the tray to go bad is:
Taverage = [(8+7+6+6+5+4)/6] hours=6 hours
This can be seen easier on the following histogram:
Applying my formula for calculating the approximate average time for the tray to go bad:
Trough average = ¾(M+N) = ¾(5+5) = 7.5 hours
Again the result is that the approximate average is close to the true average different by 20%.
I predict that as the size of the tray increases, the true average time required for the tray to go bad and the approximate average time given by my formula will become closer.
Conclusion for whole investigation
I have develpoed a general formula for calculating the time for a tray of any size to become rotten, starting from one tomato. I applied the formula to the practical case of square size 4 by 4. The formula does not cover the case of several tomatoes going bad at the beginning in different places of the tray. I can only say that the tray will become rotten faster in this case. I have also devised a formula which calculates the approximate average time required for a tray of any size to go bad and tested it on trays 4 by 4 and 5 by 5 which show that it is accurate within 20%.