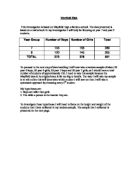
Now that I have presented these results in a cumulative frequency table I will now record these results in different types of graphs and diagrams. By doing this I will discover any relationship between boys and girls heights. I will begin by using bar charts to compare the boys and girls heights.
The evidence from these bar charts suggests that girls have a higher height than boys but boy’s height is more spread. I know that if I investigate further by using mean, median, mode and range I will have clear evidence of the boys and girls heights.
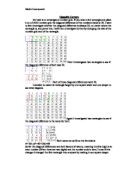
Firstly I will investigate the boys and girls mean height I will do this by using my frequency tables.
Mean = 8670/64 Mean= 160.5555
The mean height for boys is 161 cm or in meters it is 1.61m
Mean=8260/52 Mean=158.8461
The mean height for girls is 159cm or in meters 1.59m
I will now investigate the modal height for boys and girls.
Modal height for boys is 150≤h<160
The modal height for girls is 160≤h<170
I have now worked out the modal height so I am now moving on to investigate the median.
The sample that I have taken has 52 girls and 64 boys in order to find out the median for girls I will have to half 52. This equals 26 this means I look at the 26 person to find out the median height this will give me the girls median. To find out the boys median I will also have to half the amount of people there is. Half of 54 equals 27, I now have to look for the 27th boy in the list and find out the median height.
Boys median=1.55m or 155cm
Girls median=1.59m or 159cm
I will take a look at the range of height; this shows me the spread of my data for both girls and boys. The range is found by taking the highest value from the lowest value.
Range of height for boys =130-203=73cm
Range of height for girls= 130-180=50cm
I will now put the results of my mean, median, mode and range into a table so it is clear to see the differences.
The boys had a higher mean and also a higher range. The girl’s mode was higher than the boys and this means that more girls are taller than boys so my first hypothesis is incorrect. This investigation has shown me the girls in Mayfield high are generally taller than boys. I will now move on to investigate my second hypothesis.
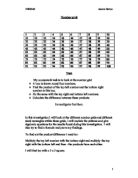
To investigate my second hypothesis I will have to use scatter graphs. If I have positive correlation on my scatter graph it will mean that the hypothesis is correct. I would expect to see positive correlation and the best way to investigate this would be to use scatter graphs.
The results from the scatter graph show that there is a positive correlation. This means that generally the taller someone is the heavier they are. I done separate scatter graph for boys and girls this was to show that it was anything thing to do with what a gender a person is. The two graphs both male and female graphs showed positive correlation.